IoT Weight Logging Scale
 SFUptownMaker
 Introduction
This tutorial will show you how to hack a bathroom scale to post weight data to a custom website that you create! The principles involved in this can easily be adapted to work with any kind of sensor data you choose: insolation, temperature, weather data, or anything else that you want to track over time and get a visualization.
It uses an ESP32 Thing to read load cell data from an HX711 Load Cell Amplifier and display that data on a Serial 7-Segment Display as well as posting it to a Python-based website that can be hosted locally or on the cloud.
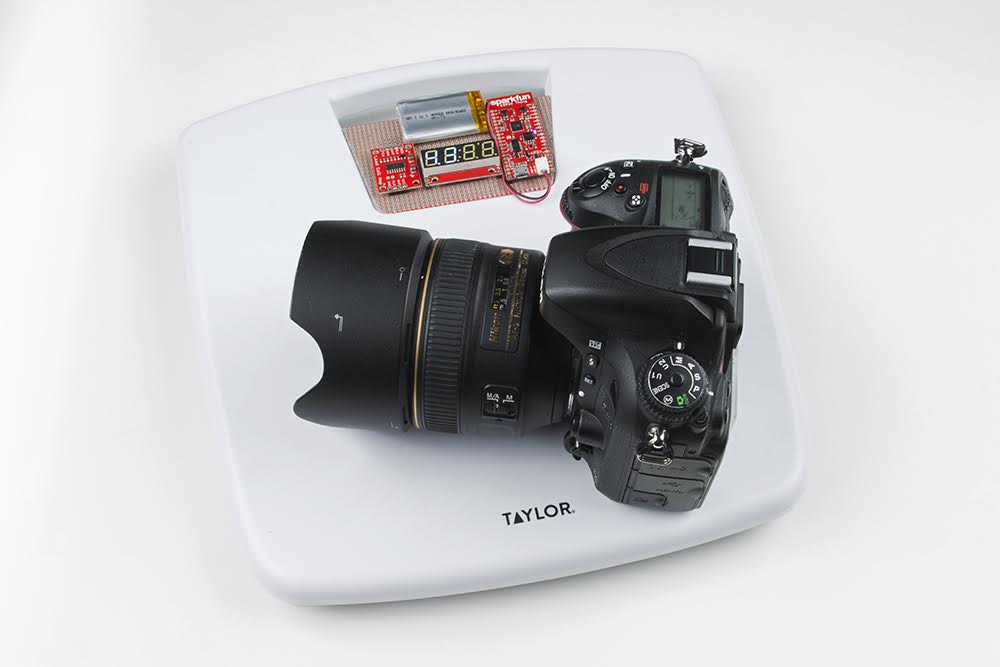
Required Materials
Hardware
To follow this project, you would will need the following materials. You may not need everything though depending on what you have. Add it to your cart, read through the guide, and adjust the cart as necessary.
Software
I've chosen to use a remotely hosted Linux server on Linode to host my website, but if you so choose you can host it locally using a Raspberry Pi 3 or other flavor of Linux-based computer. You'll need to download and install the ESP32 support package--instructions are available on that page. The library for the HX711 amplifier can be found and installed through the Arduino Library Manager. I used the one titled "HX711_ADC" by Olav Kallhovd, so make sure you download the right one. I used Python 2.7, which should be the default if you follow my instructions. You'll also need to install Flask, matplotlib, and (maybe) tkinter. I'll go through the installation instructions on those later.
Tools
No special tools are required to follow this tutorial. You will need a soldering iron, solder, general soldering accessories, and a screwdriver to disassemble the scale.
Suggested Reading
Before undertaking this project, there are a few tutorials that you may want to review.
How to Solder: Through-Hole Soldering
Using the Serial 7-Segment Display
Raspberry Pi 3 Starter Kit Hookup Guide
ESP32 Thing Hookup Guide
Load Cell Amplifier HX711 Breakout Hookup Guide
Using Flask to Send Data to a Raspberry Pi
Hardware Hookup
You'll need to connect up the hardware before going any farther. We'll walk you through it.
Connect Up the Scale
I bought a Taylor model 7058 scale for this project at my local Target store. I chose it because it was cheap and looked like it might have an LED display (it doesn't). I had hoped to repurpose a significant amount of the internal hardware but in the end, all I was able to salvage was the body and load cells.
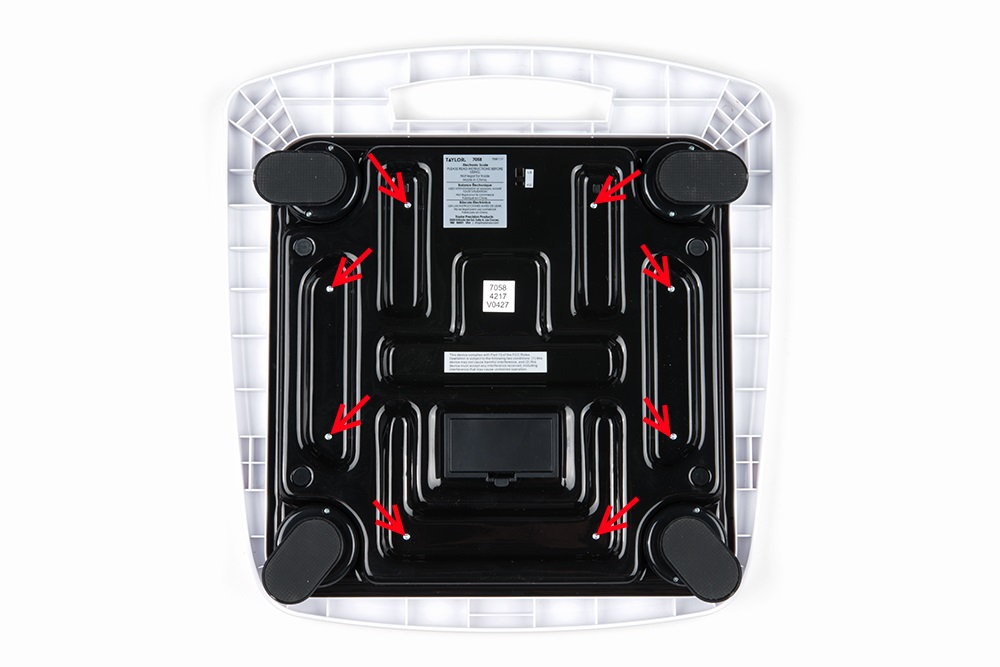
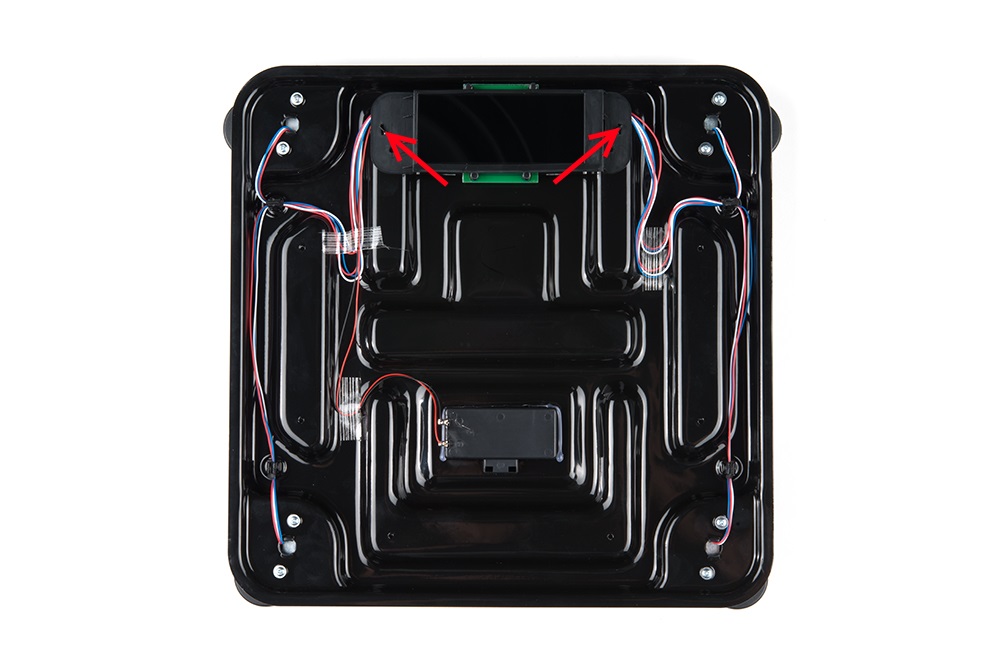
Start by removing the screws from the underside of the scale. The image below has red arrows pointing to the screws that need to be removed. Other screws do not need to come off and in fact, should not be removed.
Flip the scale over and lift the top plate off, carefully. The electronics are held in a box that is attached to the bottom plate by a couple of twisted tabs, marked in the image below with red arrows.
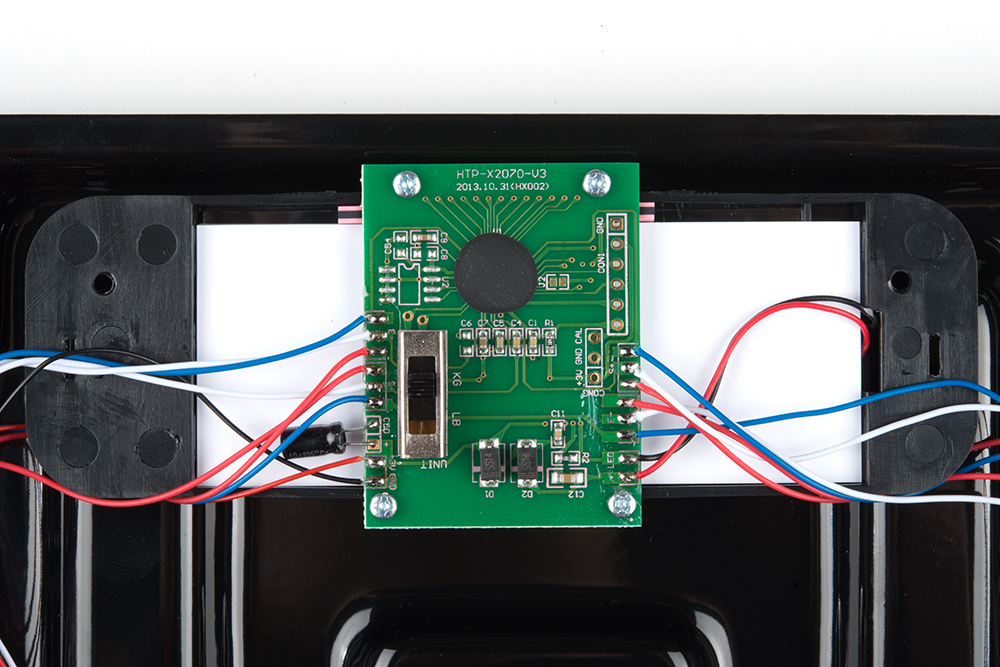
Snip the wires off the PCB. I prefer to snip the wires and restrip them rather than desoldering as I feel it gives a cleaner end to the wire, leaving the wires less likely to fray. You can pitch the entire electronics subassembly-- we won't be reusing any of it.
You'll now need to reconnect the wires, some to one another, others to the amplifier. Check out the drawing below for the order in which to hook up the wires. The upper left sensor's blue wire connects to the upper right sensor's blue wire. The upper left sensor's red wire connects to the lower left sensor's red wire. The lower left sensor's blue wire, to the lower right sensor's blue wire, and the lower right sensor's red wire, to the upper right sensor's red wire. Red to red, blue to blue.
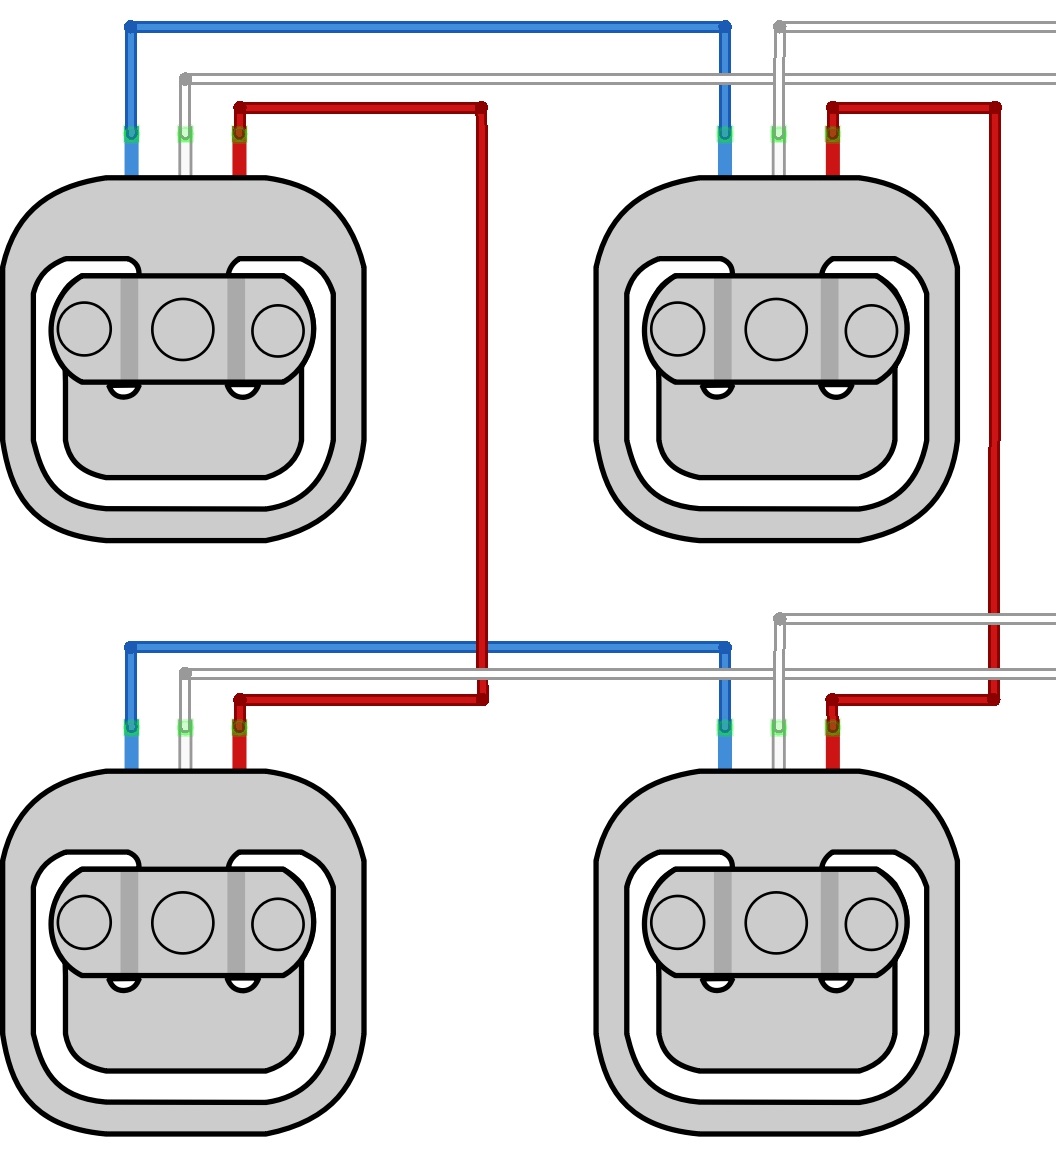
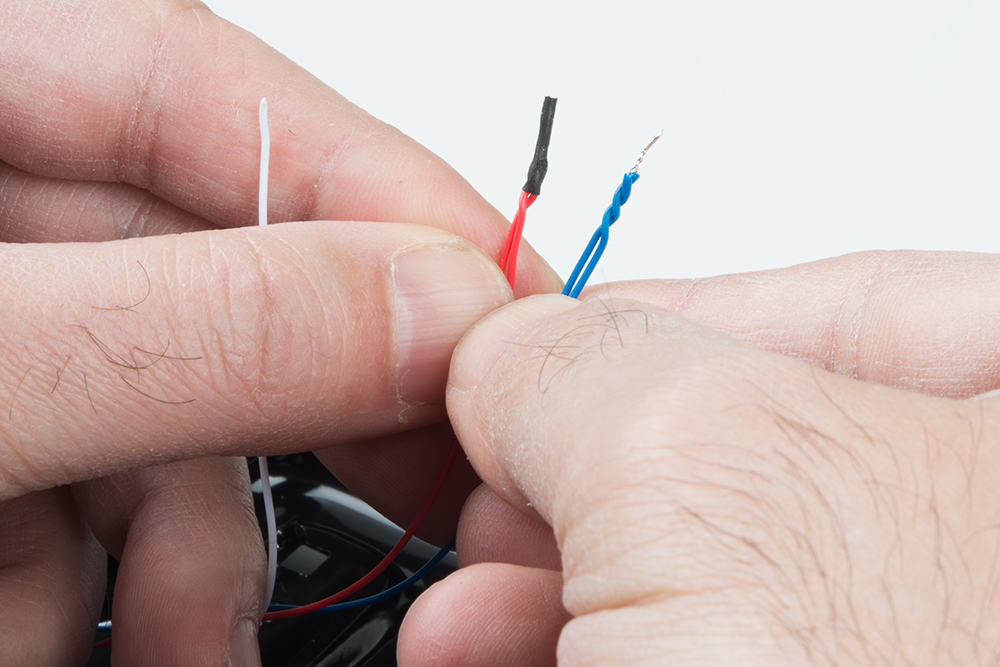
My strategy is to strip perhaps 3-4mm of the end of the wire and twist the two wires together, then solder the bare ends and slip a small section of heat shrink tubing over the joint. The white wires will be connected to the amplifier, so don't worry about them right now.
Connect Up the Electronics
Now that you've got the scale all ready to go, you can bring in the electronics. Below is a hookup diagram showing how to wire them all together. To power the project remotely, we'll be using a LiPo battery.
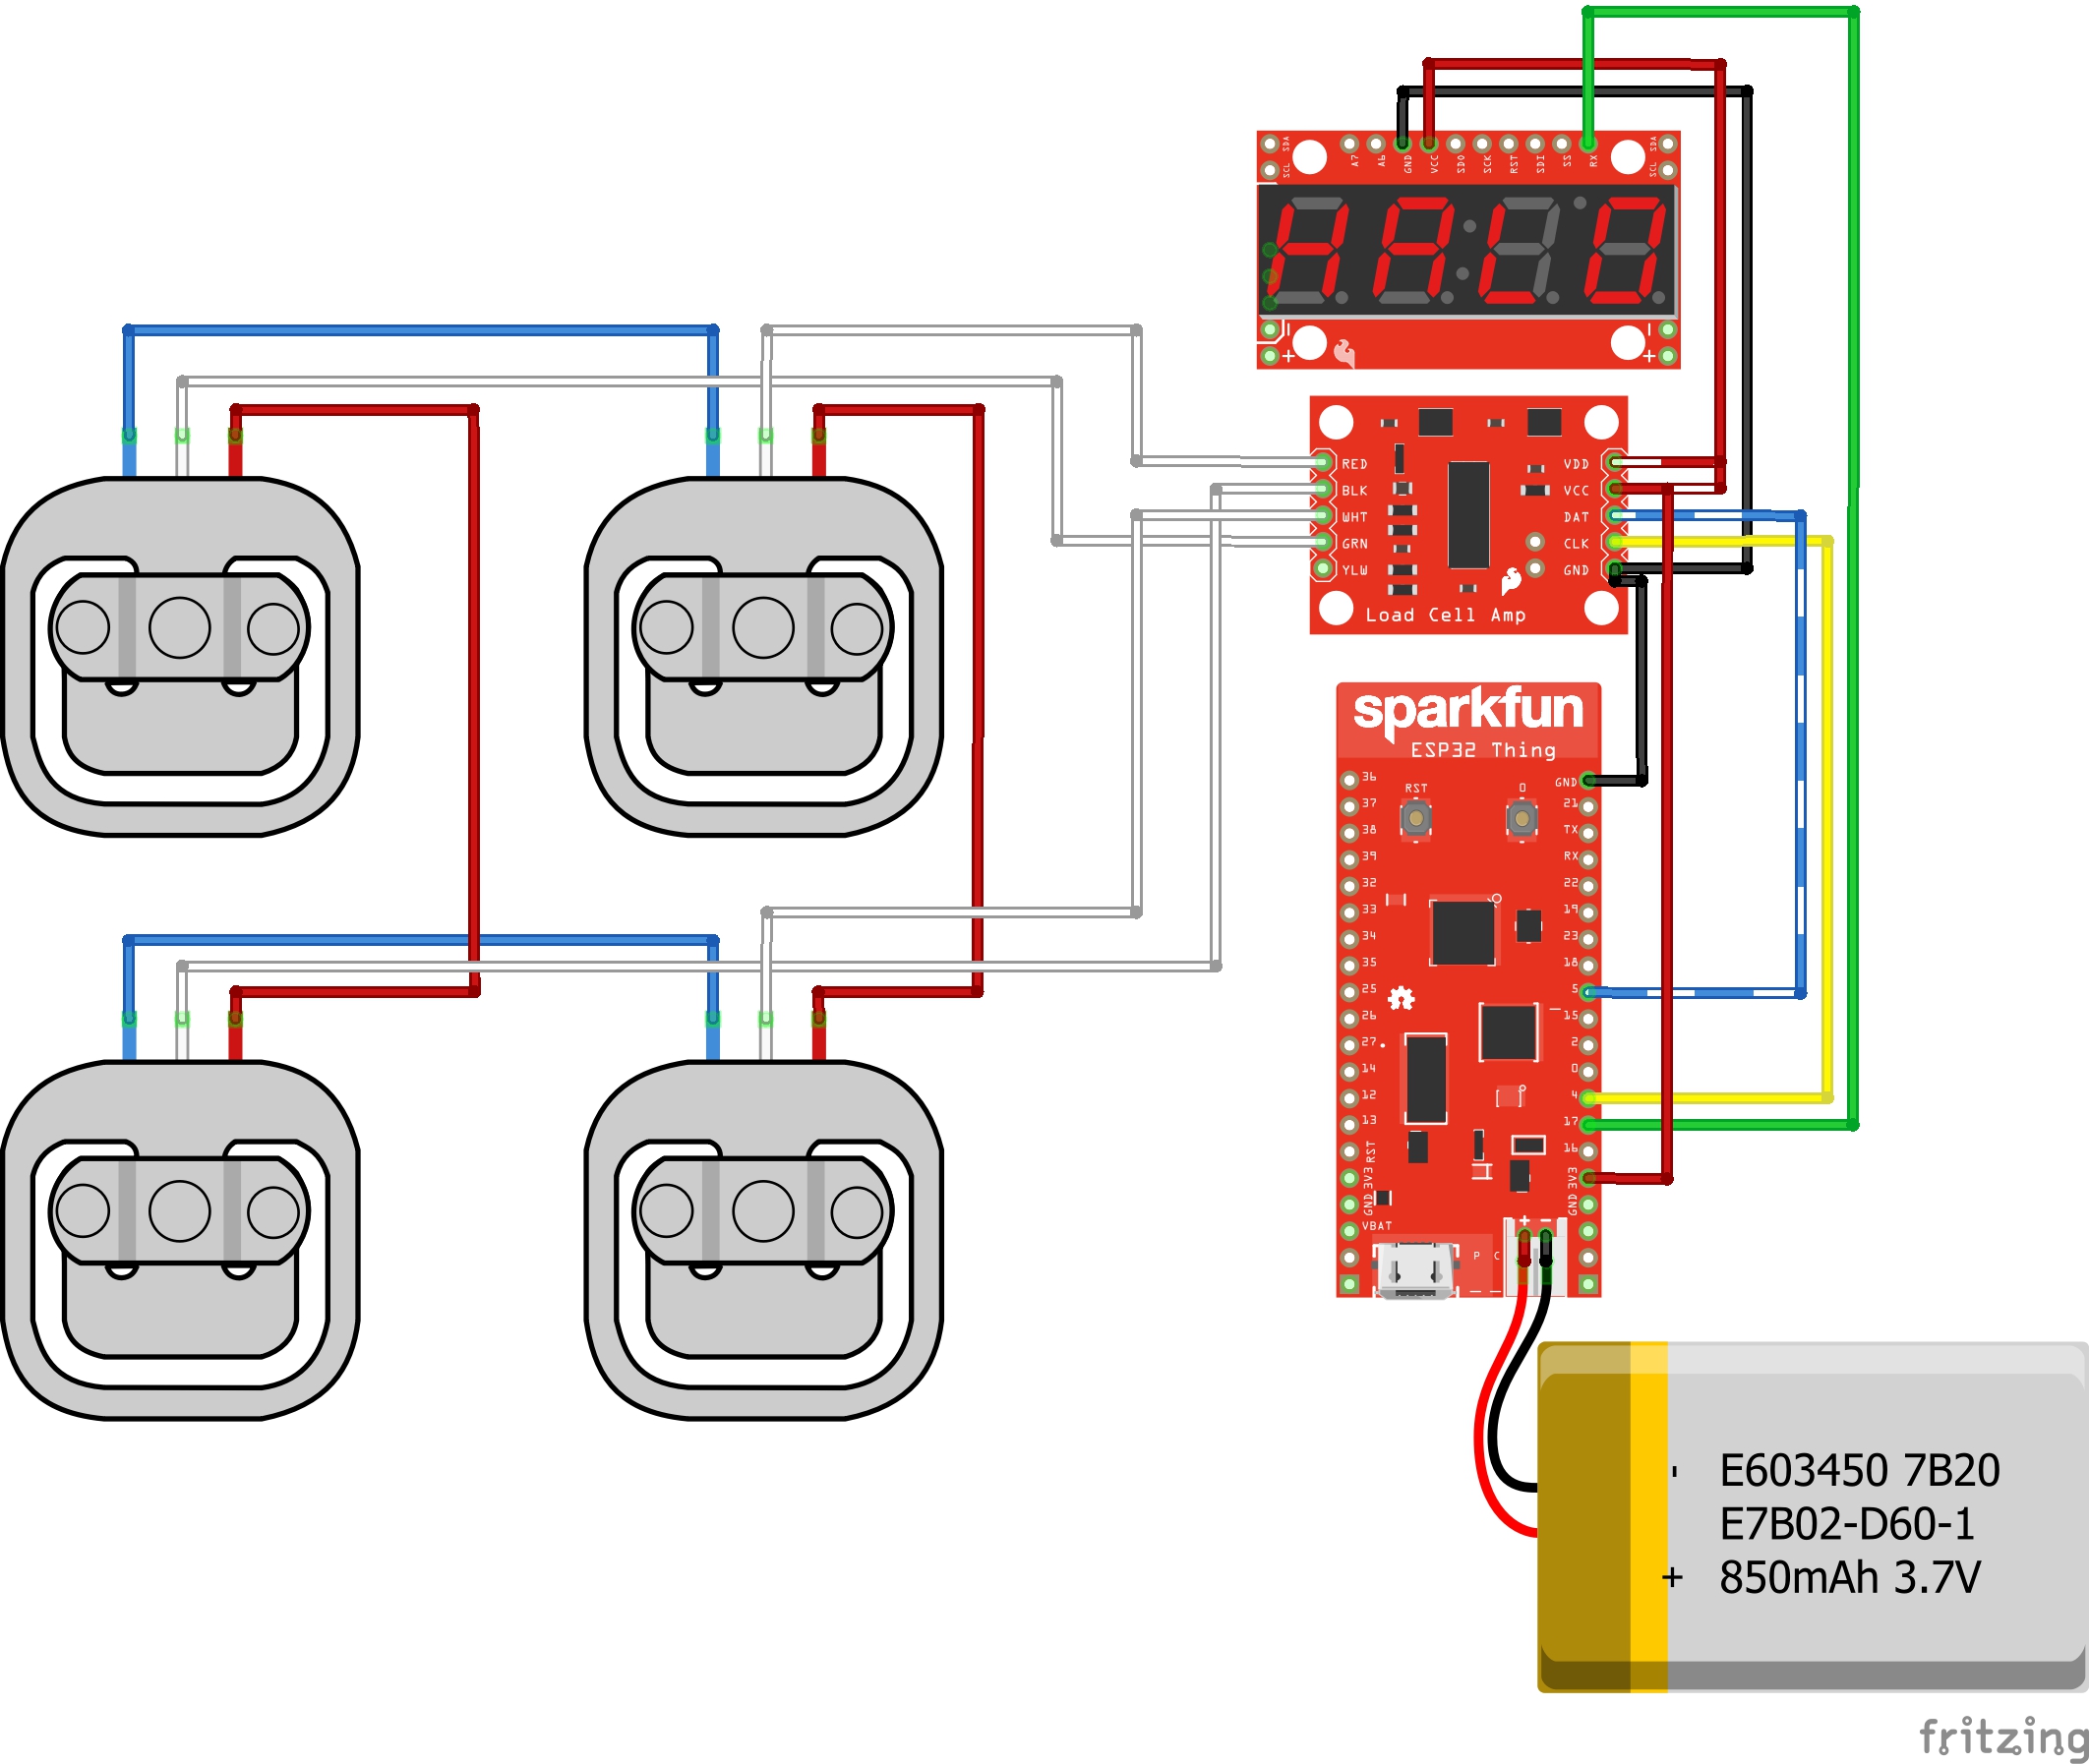
I chose to pop out the plastic window that the display had previously been behind so I could run the wires out the front and mount my electronics on the outside. You may want to try squeezing everything inside the case, as it will probably fit and will give a cleaner build. However, it does make accessing the power port on the ESP32 Thing more difficult for either powering or charging.
Calibrating the Scale
Note: This example assumes you are using the latest version of the Arduino IDE on your desktop. If this is your first time using Arduino, please review our tutorial on installing the Arduino IDE. If you have not previously installed an Arduino library, please check out our installation guide.
Before we go farther into the project, we need to calibrate our scale. I've modified the calibration sketch that comes with the HX711 library to display on the scale's serial 7-segment display to make it slightly easier to use.
Upload Code to the ESP32
Here's the calibration sketch:
language:cpp
#include <HX711_ADC.h>

//HX711 constructor (dout pin, sck pin)
HX711_ADC LoadCell(5, 4);
HardwareSerial Serial2(2); // Enable 3rd serial port on ESP32

long t;

void setup() {
  Serial.begin(115200);
  Serial2.begin(9600);
  Serial.println("Wait...");
  LoadCell.begin();
  long stabilisingtime = 2000; // tare preciscion can be improved by adding a few seconds of stabilising time
  LoadCell.start(stabilisingtime);
  LoadCell.setCalFactor(10000.0); // user set calibration factor (float)
  Serial.println("Startup + tare is complete");
}

void loop() {
  //update() should be called at least as often as HX711 sample rate; >10Hz@10SPS, >80Hz@80SPS
  //longer delay in scetch will reduce effective sample rate (be carefull with delay() in loop)
  LoadCell.update();

  //get smoothed value from data set + current calibration factor
  if (millis() > t + 250) {
    float i = fabs(LoadCell.getData());
    float v = LoadCell.getCalFactor();
    Serial.print("Load_cell output val: ");
    Serial.print(i);
    Serial.print("      Load_cell calFactor: ");
    Serial.println(v);

    // Create a string which is the integer value of the weight times 10,
    //  to remove the decimal point.
    String weight = String(int(i*10));
    Serial2.write(0x76); // Clear the display
    Serial2.print(weight); // Write out the weight value to the display

    // Identify which decimal point to set, and set it.
    int shiftBy = 5-weight.length();
    int decimalPoint = 0x08>>(shiftBy);
    Serial2.write(0x77);
    Serial2.write(decimalPoint & 0x0F);

    t = millis();
  }

  //receive from serial terminal
  if (Serial.available() > 0) {
    float i;
    char inByte = Serial.read();
    if (inByte == 'l') i = -1.0;
    else if (inByte == 'L') i = -10.0;
    else if (inByte == 'h') i = 1.0;
    else if (inByte == 'H') i = 10.0;
    else if (inByte == 't') LoadCell.tareNoDelay();
    if (i != 't') {
      float v = LoadCell.getCalFactor() + i;
      LoadCell.setCalFactor(v);
    }
  }

  //check if last tare operation is complete
  if (LoadCell.getTareStatus() == true) {
    Serial.println("Tare complete");
  }

}
It's pretty simple. It reads the HX711 four times a second and prints the results both to a serial console and to the 7-segment display. Note that it tares the scale at boot, so don't have any weight on the scale when you start it up!
Find the Calibration Factor
I prefer using a dedicated serial tool such as CoolTerm or a terminal program like Putty over the Arduino serial console for this step. You're going to have to step through quite a lot of values and the Arduino console isn't good for that.
The calibrate routine looks for the user to send characters over the serial console to adjust the calibration factor. The calibration factor starts at 10000 (arbitrarily), and must be increased or decreased from there until the weight reading is correct. Try increasing it first, by sending 'H' (for a 10-point increase) or 'h' (for a 1-point increase), and observe the weight reading. If the measurement gets closer to correct, keep increasing the calibration factor until the reading on the 7-segment display is true to the weight on the scale.
If the measurement gets farther from correct, try lowering the calibration factor by sending 'L' or 'l'. Note that if you are using a terminal program or serial tool other than the Arduino IDE tool, you can probably just hold down the key to constantly sending characters and change the calibration factor quite quickly.
Write that Number Down!
You'll want to record the final calibration factor so you can include it in the final version of the sketch.
ESP32 Example Code
The code for the ESP32 is relatively simple. It's basically a mash-up of examples from the ESP32 core and the HX711 library.
First, it configures the hardware and software in the ESP32. This is where you'll use the calibration factor you discovered on the previous section. Here, it's set to 10920, which is what my scale needs. Replace that number with the one you discovered.
language:cpp
#include <Arduino.h>
#include <WiFi.h>
#include <WiFiMulti.h>
#include <HTTPClient.h>
#include <HX711_ADC.h>

WiFiMulti wifiMulti;
HX711_ADC LoadCell(5,4);   //HX711 constructor (dout pin, sck pin)
long scaleTick, httpTick;
HardwareSerial Serial2(2); // Enable the third hw serial port on the ESP32

void setup()
{
  Serial.begin(115200);
  Serial2.begin(9600);

  Serial.println();
  Serial.println();
  Serial.println();

  // Give background processes a few seconds to complete
  for(uint8_t t = 4; t > 0; t--)
  {
    Serial.printf("[SETUP] WAIT %d...\n", t);
    Serial.flush();
    delay(1000);
  }

  wifiMulti.addAP("ssid_goes_here", "password_goes_here");

  // Set up the HX711 library
  LoadCell.begin();
  LoadCell.start(10); // Start up the HX711 library with 10ms delay
  LoadCell.setCalFactor(10920); // user set calibration factor (float)
  Serial.println("Startup + tare is complete");
}
Next, it enters loop(). where it checks the weight every 250ms and keeps a running average of the weight over the last four cycles. If the average over the last four cycles is close enough (less than 0.1lb off) of the current reading, it posts the weight data to the internet. Some checking is done to make sure that a large-ish (greater than 30lbs) weight is present on the scale, and that only one update happens per stabilized weight (i.e. the weight returns to zero before another weight is posted to the website).
language:cpp
void loop()
{
  static float history[4];
  static float ave = 0;
  static bool stable = false;
  static bool webUpdated = false;
  static float weightData = 0.0;

  // Update the website with weight data IF the weight data is stable AND the
  //  website hasn't been updated yet.
  if (stable && !webUpdated)
  {
    // Only try if the wireless network is connected
    if((wifiMulti.run() == WL_CONNECTED))
    {
      HTTPClient http;

      Serial.print("[HTTP] begin...\n");
      Serial.println(weightData);
      // Replace 0.0.0.0 in address with your IP address
      String address = "http://0.0.0.0:5000/post_weight/";
      // Create a string with one decimal point of the average of the weights
      //  collected
      String weight = String(weightData, 1);
      // cat the two together
      String fullAddress = String(address + weight);
      // Connect to the server with the address you've created
      http.begin(fullAddress);

      Serial.print("[HTTP] GET...\n");

      // start connection and send HTTP header
      int httpCode = http.GET();
      // httpCode will be negative on error
      if(httpCode > 0)
      {
        // HTTP header has been send and Server response header has been handled
        Serial.printf("[HTTP] GET... code: %d\n", httpCode);

        // file found at server, response 200
        if(httpCode == HTTP_CODE_OK)
        {
          // clear the stable flag as the data is no longer valid
          stable = false;
          // Set the webUpdated flag as we've successfully updated the website
          webUpdated = true;
          Serial.println("Web updated");
          // Dim the LED display for 500ms, then turn it back on
          Serial2.write(0x7a);
          Serial2.write(0);
          delay(500);
          Serial2.write(0x7a);
          Serial2.write(255);
        }
      }
      else
      {
        Serial.printf("[HTTP] GET... failed, error: %s\n", http.errorToString(httpCode).c_str());
      }

      http.end();
    }
  }

  // Check the weight measurement every 250ms
  if (millis() - scaleTick > 250)
  {
    scaleTick = millis();
    // Read from the HX711. Must do this before attempting to use data!
    LoadCell.update();
    // We take the abs of the data we get from the load cell because different
    //  scales may behave differently, yielding negative numbers instead of
    //  positive as the weight increases. This can be handled in hardware by
    //  switching the A+ and A- wires, OR we can do this and never worry about it.
    weightData = abs(LoadCell.getData());
    // Calculate our running average
    history[3] = history[2];
    history[2] = history[1];
    history[1] = history[0];
    history[0] = weightData;
    ave = (history[0] + history[1] + history[2] + history[3])/4;

    // IF the average differs from the current by less than 0.3lbs AND
    //  the average weight is greater than 30 pounds AND
    //  we haven't recently updated the website, set the stable flag so
    //  we know that the weight is stable and can be reported to the web
    if ((abs(ave - weightData) < 0.1) &&
        (ave > 30) &&
        !webUpdated)
    {
      stable = true;
    }

    // IF we've updated the website AND
    //  the average weight is close to zero, clear the website updated flag
    //  so we are ready for the next weight reading
    if (webUpdated && ave < 1)
    {
      webUpdated = false;
    }

    Serial.print("Load_cell output val: ");
    Serial.println(weightData);

    // Create a string which is the integer value of the weight times 10,
    //  to remove the decimal point.
    String weight = String(int(weightData*10));
    Serial2.write(0x76); // Clear the display
    Serial2.print(weight); // Write out the weight value to the display

    // Identify which decimal point to set, and set it.
    int shiftBy = 5-weight.length();
    int decimalPoint = 0x08>>(shiftBy);
    Serial2.write(0x77);
    Serial2.write(decimalPoint & 0x0F);
  }
}
Web Code
The web application is developed under Flask, which is a light web framework allowing Python applications to be deployed on the web. Here, we'll get into the directory structure and file structure of the Flask app. We're going to assume that you're going into this with a naive installation of Linux: perhaps a new Linode server, or a new Raspberry Pi. We're also going to assume that you have a console window open to whatever server you're going to use and that the server is connected to the Internet.
Install Flask
The first step is to install Flask. Simply type the following:
language:bash
sudo pip install flask
That should install flask automatically.
Install Tkinter and Matplotlib
You'll now need to install Matplotlib, so you can generate plots of your collected data. First, you need to make sure that Tkinter is installed. It probably is if you're working on any kind of server that is expected to have a desktop option (like a Raspberry Pi). In the case of something like Linode, where your primary interface is expected to be a command line, Tkinter may not be installed. Use the following command:
language:bash
sudo apt-get install python-tk
That will install Tkinter. Next we can install Matplotlib.
language:bash
sudo pip install matplotlib
That should install Matplotlib and all its dependencies.
Create the Directory Structure
The Flask app we're going to create has a directory structure that allows all the various pieces to be segregated into functional groups. Here's the structure you want to keep it neat and tidy:
website
└── app
    ├── images
    └── templates
As we go through the rest of the tutorial, we'll populate these directories with the appropriate files. Note that the top-level directory (website) can be located wherever you please and named, but I like to leave it in my home directory for ease of access. We're also going to assume that you followed this template for the rest of the tutorial, so it's to your benefit to do so.
Add the FLASK_APP Variable to Your Path
By adding the FLASK_APP variable to the path, we allow Flask to be run from a very simple command, which saves us time in the long run. Type:
language:bash
export FLASK_APP=~/website/website.py
This of course assumes that you created the directory named website in your home directory. If not, change the path accordingly.
You probably want to add this line to your .bashrc file, so you don't have to type this command in every time you log into the server.
Create Your First Files
Unsurprisingly, our first file is going to be called website.py and is going to be located in the top-level website directory. The contents of the file are very simple:
language:bash
from app import app
We'll create the app class that we're importing in a minute.
Next, create the config.py file in the same place. This file is used to store site configuration information, but we'll only be storing one little piece of info in it.
language:python
import os

class Config(object):
    SECRET_KEY = os.environ.get('SECRET_KEY') or 'you-will-never-guess'
The SECRET_KEY is used by Flask to verify the signature of cookies to ensure that they haven't been tampered with by some third party. We won't make use of it, but it's good practice to set it up.
Create Your App Files
Now it's time to create the meaty parts of the project, the files that actually do something. These files will go in the app directory.
Start with the __init__.py file. This is a super important file which allows us to put our actual app in the app directory and have python treat it as a module that can be imported:
language:python
from flask import Flask
from config import Config

app = Flask(__name__)
app._static_folder = 'images'
app.config.from_object(Config)

from app import routes
We first import Flask, which is (obvi) our overall Flask support object. From the config file, we created earlier, we import the Config class, which stores configuration data for flask, although ours is tragically underutilized. We then create an object of the Flask class named app, which will be imported throughout the rest of the program. app._static_folder_ tells Flask where to expect static files (such as images) to be served from. "Static" is here somewhat of a misnomer, as the files in that directory can change, they just are expected to not be templates to be rendered. Lastly, we configure our Flask object with the Config object we imported earlier.
Let's look at our routes.py file. It goes in the app directory, and looks like this:
language:python
from flask import render_template, send_from_directory
from app import app
from weight import add_weight_point
from plot_weight import plot_weight

@app.route('/')
@app.route('/index')
def index():
    return render_template('index.html', title='Home')

@app.route('/images/<path:path>')
def send_image(path):
    return send_from_directory('images', path)

@app.route('/post_weight/<string:weight>')
def post_weight(weight):
    add_weight_point(weight)
    plot_weight()
    return "weight posted"
The routes.py file is the secret sauce that allows our app to know what to do when a request comes in from a remote client. At the top, we import all the various bits and bobs that make our project work. We import render_template and send_from_directory from flask to support routes that we make for rendering templates and displaying images. We import the app object that we created in __init__.py, and then the add_weight_point and plot_weight functions that we'll create in a little while.
The decorators @app.route('/') and @app.route('/index') tell the Flask app what to do when a request for either of those paths comes in. In this case, we would choose to render a template called index.html. We'll cover templates a little later, but for now, just know that this is the document that gives a webpage its appearance.
The @app.route('/images/<path:path>') decorator is of particular interest because for the first time, we see a path with a variable in it. This route serves up any file requested from the images directory. This is important because Flask isn't a full-featured web server, so it doesn't know what to do with requests that it has no route for.
The third and final route, @app.route('/post_weight/<string:weight>'), is interesting because it's a purely server-side function. It does return a response (the string "weight posted"), but its primary function is to take the string passed to it and concatenate it to the weight file, then plot the data in the weight file.
Next, we create the supporting files, to which we outsource the recording of data points and the plotting of data on a chart. We'll look at weight.py first, which does the recording portion:
language:python
from datetime import datetime
import pytz

def add_weight_point(weight):
    file_name = "weight"
    try:
        with open(file_name, 'a') as f:
            f.write(weight + ", ")
            tz = pytz.timezone('America/Denver')
            local_now = datetime.now(tz)
            dt_string = str(local_now.date()) + ' ' +  str(local_now.time())
            f.write(dt_string + "\n")
    except:
        print "Weight sad :-("
        pass

if __name__ == "__main__":
    add_weight_point("0.0")
We need datetime and pytz to create timezone-aware date and time values for when we post our data. The meat of the function is enclosed in a try/except clause, mostly to make debugging easier during development, but it could prove helpful in deployment too. We open our file in append mode, which automatically places the cursor at the end of the file, then plop in the weight value (which was received as a string from the calling function, our route handler in the prior file) with a comma to provide separation for readability. We then create a timezone object for my timezone ('America/Denver'), and fetch the local date and time (as a datetime object). The local time and date are converted to strings and appended to the file. Finally, we provide a directive to how to handle the case where this file is called as the main file (i.e., run by itself, for test purposes): call the add_weight_point() with a string of "0.0".
Finally, before you can run the application, you need to create the file that stores the weight data. This is easily done with this command:
touch weight
The final code file we create is plot_weight.py. This file uses Matplotlib to create a .png file of a graph of all the data in our weight data file.
language:python
from datetime import datetime
import matplotlib
matplotlib.use("Agg")
import matplotlib.pyplot as plt

def plot_weight():
    file_name = "weight"
    weight_data = []
    date_data = []
    with open(file_name, 'r') as f:
        file_data = f.readlines()
        for line in file_data:
            line = line.strip().split(', ')
            line = [line[0], datetime.strptime(line[1],
                                               "%Y-%m-%d %H:%M:%S.%f")]
            weight_data.append(float(line[0]))
            date_data.append(line[1])

    fig = plt.figure()
    plt.plot(date_data, weight_data)
    plt.xticks(rotation = 75)
    fig.savefig('images/plot.png', bbox_inches='tight')

if __name__ == "__main__":
    plot_weight()
The import section is fairly self explanatory, except for the line matplotlib.use("Agg"). This line forces Matplotlib to ignore the fact that no X server is available for plotting. Without it, the Tkinter GUI library will throw an error when you try to plot, even if you're plotting to an output file. The rest of the file is pretty easy to understand: import the data file into a one-line-per-element list, then create two separate lists for weight data, one of float values and one of datetime objects. It creates a pyplot figure, plots the data, rotates the labels on the x-axis so they don't overlap, and then saves the figure to an image.
Create the HTML Templates for Displaying Data
As mentioned previously, one of the beautiful things about Flask is that it can render templates for displaying pages. This means that you can have one template (say, base.html) that handles the page header and footer material while other pages render into that template.
We're going to start by placing a base.html file in our templates directory. Here's the content of that file.
<html>
  <head>
    {% if title %}
    <title>{{ title }} - A Website</title>
    {% else %}
    <title>A Website</title>
    {% endif %}
    {% block head_content %}{% endblock %}
  </head>
  <body style="background-color:#42dff4">
    {% block body_content %}{% endblock %}
  </body>
</html>
I'm not going to explain the html portions of this document, just the templating that makes it different. There are three templating concepts in play here: variables, if/else statements, and blocks. You can see that we create an if/else statement which checks the variable title to see if it is defined. If it is defined, we set the title of the page accordingly. If not, we use a default title. If you scroll back up and look at our routes.py file, you can see that when we rendered that template, we passed in the title variable, set to "Home". The other templating concept is that of a text "block". To illustrate how that works, I'm going to need to pull in the contents of our other html template, also created in the templates folder: index.html.
{% extends "base.html" %}

{% block head_content %}
{% endblock %}

{% block body_content %}
  <img src="images/plot.png" alt="Plotted data" />
{% endblock %}
First, you can see the "extends" statement. That tells Flask that this file should be viewed through the lens of base.html, and that the two together create a single document. Now check out the block statements. The "head_content" block is empty--nothing will be created there. However, in the "body_content" block, there is a link to the image created by plot_weight.py. When Flask goes to render the index.html template, it will "draw" first base.html, then it will pull all the block content from index.html into the appropriate places in base.html. You can see how this can be extremely powerful, allowing you to render websites in which 10% of the content is generated by a base template and the other 90% comes from specific subpages that you wish to display.
Deploy!
If you've been following along, your Linux server should be prepped and ready to have your website deployed! To launch your app all you have to do is run this command:
language:bash
flask run -h 0.0.0.0
That uses that FLASK_APP variable that we set up earlier to determine where the application to be launched is and launches it. The -h 0.0.0.0 switch tells it that you want the app to be visible to the outside world. If you're running this on a Raspberry Pi, it should be visible to any computer on the same network as the Raspberry Pi, but probably not the whole internet. If you're running on a Linode (or other cloud service) server, then you should be able to access the web page from anywhere.
There's a problem, though: once you disconnect your console from the server, the Flask app process gets killed and the page will no longer be accessible. To get around that, we use the "no hangup" command, telling the server to run the process in the background and not kill it when the console disconnects. To do this, enter the command thus:
language:bash
nohup flask run -h 0.0.0.0 &
Now the task will run in the background and you can disconnect from the server without affecting it. To terminate the process, you have to do a little more work. First, you must find the process id for your app. To do this, use the following command:
language:bash
pgrep flask
That will return the PID for the current running flask instance. To then stop that process, type:
language:bash
kill <PID>
Replace <PID> with the process ID that you found in the previous step. That will stop the process. You'll need to stop and restart the process any time you make any changes to any of the files other than the image file.
Resources and Going Further
For more information, check out the resources below:
- GitHub Project Repo - IoT weight logging scale project repo.
- Linode - High performance SSD Linux servers for cloud hosting.
- GitHub ESP32 Repo - ESP32 Arduino core files and support packages.
- Flask Framework - Official Flask website.
- Simple Flask Tutorial - This basic Flask tutorial will walk you through taking Flask a little bit farther than we have here.
- Complex Flask Tutorial - This more advanced tutorial walks you through far more complex tasks with Flask, leading up to creating a Twitter clone that you can host yourself!
Need some inspiration for your next project? Check out some of these related tutorials: