Monitor Sensor Data from Anywhere
 ROB-24601, Mariah
 Introduction
We’re all familiar with WiFi. It runs our home, lets us stream our favorite movies, and keeps us from having to talk with other people when we’re at a coffee shop. But there's more ways to use WiFi than simply accessing the internet through different applications!
Picking up off a previous WiFi tutorial called Sending Sensor Data Over Wifi we showed how to create a simple, closed, peer-to-peer network that was able to read data from an environmental sensor and remotely output it on a Serial LCD. The next logical step was to take this same idea and expand it into an IoT project and view the sensor readings from anywhere in the world with an internet connection.
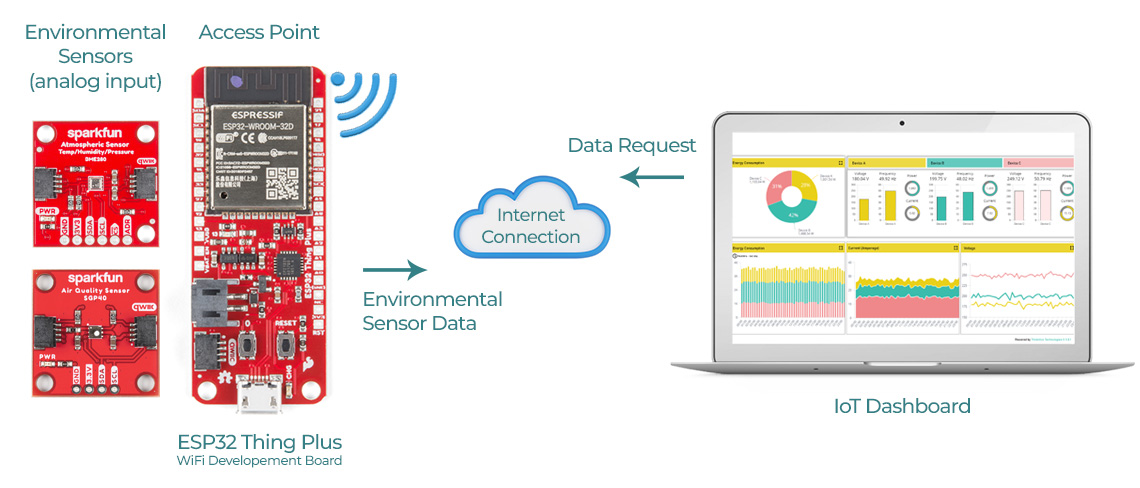
The Project: Wirelessly Monitor Temperature, Humidity, and Barometric Pressure from Anywhere!
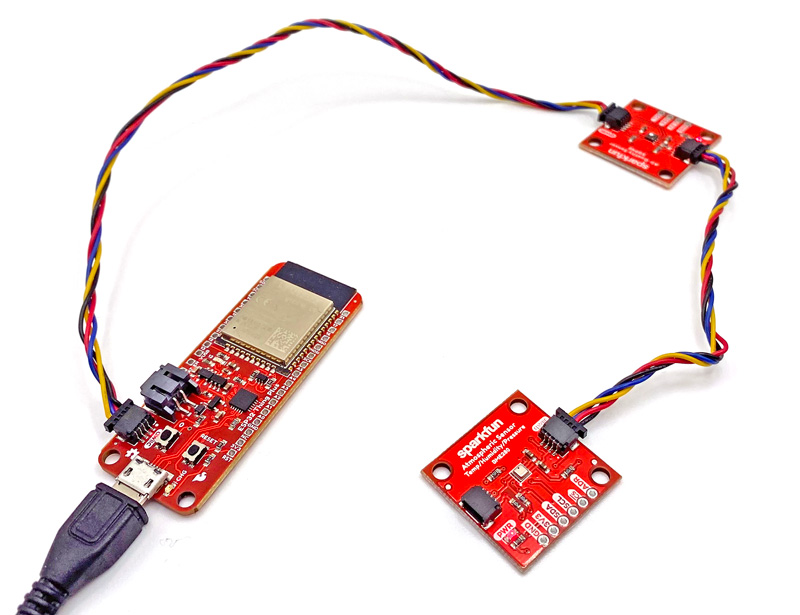
If you worked through or even just read through the first tutorial on Sending Sensor Data Over WiFi, then you know that the first step was finding the MAC address of your boards, and the second step was connecting the hardware. For this tutorial, we won’t need the MAC address, and the hardware setup is about as easy as it gets with our Qwiic Connect System. Simply connect our ESP32 Thing Plus to a single Qwiic sensor breakout using a single Qwiic cable. It’s so fast and simple that I cannot in good conscience even call it a step.
Step 1: Choose Your Dashboard
What is an IoT Dashboard?
An Internet of Things (IoT) dashboard is a data visualization tool that transforms, displays, and organizes a collection of data captured and transmitted by network-connected devices. The primary purpose of an IoT dashboard is to provide human-readable information-at-a-glance to remotely monitor historical and real-time IoT data.

You need some way to receive, translate, and ideally visualize your data. There are multiple ways to do that. If you have your own website, are comfortable doing web dev, and want 100% control and personalization, you can build your own. But for most of us, the focus here is more on IoT. I’ll share with you several options I looked into, but like most IoT projects, there is more than one correct answer. You can follow along with the one I used, or you can use this as a jumping off point, and find one that perfectly fits the needs of your project. Here's a snapshot of the IoT platforms that I looked at:
- Arduino IoT Cloud: This is a simple and fast way get your IoT project connected to the web, and has a fairly simplistic dashboard.
- Cayenne: Easy drag-and-drop UI, but a fairly specific list of compatible sensors at the moment. However, your options become much broader by utilizing Arduino or Raspberry Pi boards.
- Particle: Extremely capable, but takes a bit of digging to fully realize its potential, and uses their own line of boards. (I have been using Particle boards since their first Kickstarter campaign.)
- Thingsboard: An extremely capable platform, although previous knowledge of GNU/Linux, while maybe not compulsory, is certainly going to be helpful. (It may look at first like they don't offer a free plan, but if you look at the Community Edition rather than the Professional Edition, you'll see that they do.)
- Thingspeak: An impressive platform for data visualization as well as analysis with solid Arduino examples.
- KaaIoT: Yet another solid platform, with good Arduino functionality and examples, and some great visualization tools.
In the end I decided on using KaaIoT's free trial version for this tutorial.
Step 2: Uploading Your Code
KaaIoT has a number of examples to get you started, so we’re going to begin there. But before we can do that, we need to create a project from within the KaaIoT dashboard:
- Sign into or create a free account with KaaIoT
- Go to the cloud, and log into your Root account
- You need to create a new Solution (KaaIoT’s name for a project). Give it a name and description.
- Navigate to Device Management/Devices, and add a device. This will create a new endpoint instance, with a unique Application Version - basically a UUID.
- Get an Endpoint Token, you can create yourself, or allow Kaa to create randomly. The Token is used to verify the identity of your endpoints, so any communication request must be made from a known source. Whichever way you decide to go, it is imperative that you copy or write it down! You’ll need both the App Version and Token for your Arduino code, and KaaIoT does not put it in a secret, retrievable place for you.
For the code itself, I used code from Kaa’s GitHub repository, then pulled our own basic demo code for the BME280 and the SPG40 and melded the three.
/*
* Monitor Sensor Data from Anywhere
*
* Rob Reynolds, Mariah Kelly, SparkFun Electronics, 2022
*
* This sketch will collect data from a BME280, a SGP40, and use a
* SparkFun ESP32 Thing Plus ESP32 WROOM to send the data
* over WiFi to a KaaIoT dashboard.
* https://www.kaaiot.com/
* Want to support open source hardware and software?
* Why not buy a board from us!
* Thing Plus ESP32 WROOM - https://www.sparkfun.com/products/17381
* SparkFun Air Quality Sensor - SGP40 (Qwiic) - https://www.sparkfun.com/products/18345
* SparkFun Atmospheric Sensor Breakout - BME280 (Qwiic) - https://www.sparkfun.com/products/15440
*
* License: This code is public domain but you can buy us a beer if you use
* this and we meet someday at the local (Beerware License).
*
*/


// First we'll install all of the necessary libraries
#include <Wire.h>
#include <WiFi.h>

#include "SparkFun_SGP40_Arduino_Library.h" // Go here to get the library:     http://librarymanager/All#SparkFun_SGP40
#include "SparkFunBME280.h"

#include <PubSubClient.h> // Download here: https://github.com/knolleary/pubsubclient/archive/refs/tags/v2.8.zip
#include <ArduinoJson.h>  // This library can be found in the library manager search bar!
#include "kaa.h" // This one can be found in the LM search bar as well!

#define KAA_SERVER "mqtt.cloud.kaaiot.com"
#define KAA_PORT 1883
#define KAA_TOKEN "ESP32DemoToken"     //Put your KaaIoT Token here (Created in KaaIoT)
#define KAA_APP_VERSION "*******************-v1"  //Put your auto-generated App Version here

#define RECONNECT_TIME  5000 //ms
#define SEND_TIME       3000 //ms

// Define output names for our sensor data here
#define COMMAND_TYPE "OUTPUT_SWITCH"
#define OUTPUT_1_NAME "temperature"
#define OUTPUT_2_NAME "humidity"
#define OUTPUT_3_NAME "VOC"
#define OUTPUT_4_NAME "altitude"
#define OUTPUT_5_NAME "pressure"

const char* ssid = "WirelessNetworkName";     //WiFi network goes here
const char* password = "WirelessNetworkPassword";     //WiFi Password goes here

char mqtt_host[] = KAA_SERVER;
unsigned int mqtt_port = KAA_PORT;

unsigned long now = 0;
unsigned long last_reconnect = 0;
unsigned long last_msg = 0;

WiFiClient espClient;
PubSubClient client(espClient);
Kaa kaa(&client, KAA_TOKEN, KAA_APP_VERSION);

#define PRINT_DBG(...) printMsg(__VA_ARGS__)

BME280 mySensor;
SGP40  myVOCSensor; //create an object of the SGP40 class

void setup() {
  Serial.begin(115200);
  Serial.println("Reading basic values from BME280 and SGP40");

  //mySensor.enableDebugging(); // Uncomment this line to print useful debug messages to Serial

  setupWifi();
  client.setServer(mqtt_host, mqtt_port);
  client.setCallback(callback);

  Wire.begin();

  //Initialize sensors
  if (myVOCSensor.begin() == false) {
    Serial.println(F("SGP40 not detected. Check connections. Freezing..."));
    while (1); // Do nothing more
  }
  if (mySensor.beginI2C() == false) {   //Begin communication over I2C
    Serial.println("The sensor did not respond. Please check wiring.");
    while (1); //Freeze
  }
}

void loop() {
  if (!client.connected()) { //Checking connection
    now = millis();
    if ( ((now - last_reconnect) > RECONNECT_TIME) || (now < last_reconnect) ) {
      last_reconnect = now;
      reconnect();
    }
    return;
  }
  client.loop();

  //Sending something
  now = millis();
  if ( ((now - last_msg) > SEND_TIME) || (now < last_msg) ) {
    last_msg = now;

    //Send something here
    sendOutputsState();
  }
}

void printMsg(const char * msg, ...) {
  char buff[256];
  va_list args;
  va_start(args, msg);
  vsnprintf(buff, sizeof(buff) - 2, msg, args);
  buff[sizeof(buff) - 1] = '\0';
  Serial.print(buff);
}

String getChipId() {
  char buf[20];
  uint64_t chipid = ESP.getEfuseMac();
  sprintf(buf, "%04X%08X", (uint16_t)(chipid >> 32), (uint32_t)chipid);
  return String(buf);
}

void composeAndSendMetadata() {
  StaticJsonDocument<255> doc_data;
  String ipstring = (
                  String(WiFi.localIP()[0]) + "." +
                  String(WiFi.localIP()[1]) + "." +
                  String(WiFi.localIP()[2]) + "." +
                  String(WiFi.localIP()[3])
                );

  // Insert any fixed data you want here - board, location, any other metadata
  doc_data["name"] = "ESP32";
  doc_data["model"] = "SparkFun Thing Plus";
  doc_data["location"] = "Niwot, CO";
  doc_data["longitude"] = "40° 5' 25.5474";
  doc_data["latitude"] = "-105° 11' 6.2874";
  doc_data["ip"] = ipstring;
  doc_data["mac"] = String(WiFi.macAddress());
  doc_data["serial"] = String(getChipId());

  kaa.sendMetadata(doc_data.as<String>().c_str());
}

void sendOutputsState() {
  StaticJsonDocument<255> doc_data;

  // This is where we get sensor data, asign it to our outputs, send it to our Dashboard
  doc_data.createNestedObject();
  doc_data[0][OUTPUT_1_NAME] = mySensor.readTempF();  // read sensor data for temperature
  doc_data[1][OUTPUT_2_NAME] = mySensor.readFloatHumidity(); // read sensor data for humidity
  doc_data[2][OUTPUT_3_NAME] = myVOCSensor.getVOCindex(); // read VOC sensor data
  doc_data[3][OUTPUT_4_NAME] = mySensor.readFloatAltitudeFeet(); // read sensor data for altitude
  doc_data[4][OUTPUT_5_NAME] = mySensor.readFloatPressure(); // read sensor data for pressure
  kaa.sendDataRaw(doc_data.as<String>().c_str());  // send data to Kaa IoT Cloud

}


void setupWifi() {
  delay(10);
  Serial.println();
  Serial.print("Connecting to ");
  Serial.print(ssid);
  WiFi.begin(ssid, password);
  while (WiFi.status() != WL_CONNECTED) {
    delay(500);
    Serial.print(".");
  }
  String ipstring = (
                  String(WiFi.localIP()[0]) + "." +
                  String(WiFi.localIP()[1]) + "." +
                  String(WiFi.localIP()[2]) + "." +
                  String(WiFi.localIP()[3])
                );
  Serial.println();
  PRINT_DBG("WiFi connected\n");
  PRINT_DBG("IP address: %s\n", ipstring.c_str());
}

void callback(char* topic, byte* payload, unsigned int length) {
  PRINT_DBG("Message arrived [%s] ", topic);
  for (int i = 0; i < length; i++) {
    Serial.print((char)payload[i]);
  }
  Serial.println();
  kaa.messageArrivedCallback(topic, (char*)payload, length);
}

void reconnect() {
  PRINT_DBG("Attempting MQTT connection to %s:%u ...", mqtt_host, mqtt_port);
  // Create client ID
  String clientId = "ESP8266Client-";
  clientId += String(getChipId());
  // Attempt to connect
  if (client.connect(clientId.c_str()))
  {
PRINT_DBG("connected\n");
kaa.connect();
composeAndSendMetadata();
  } else
  {
    PRINT_DBG("failed, rc=%d try again in %d milliseconds\n", client.state(), RECONNECT_TIME);
  }
}
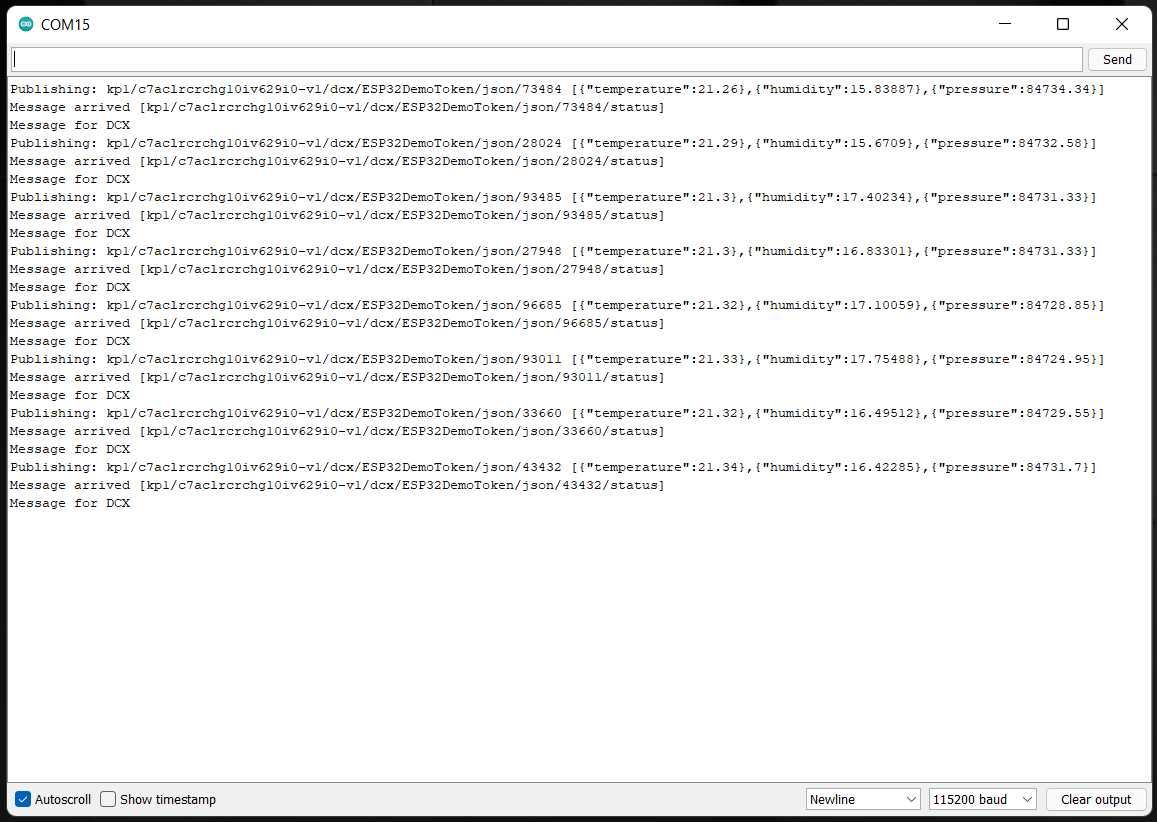
You can check that your code is working locally by opening the Arduino’s serial monitor and checking the data flow. Once that’s been confirmed, you’re ready to jump back over to your dashboard, and make sure you’re receiving the data there as well.
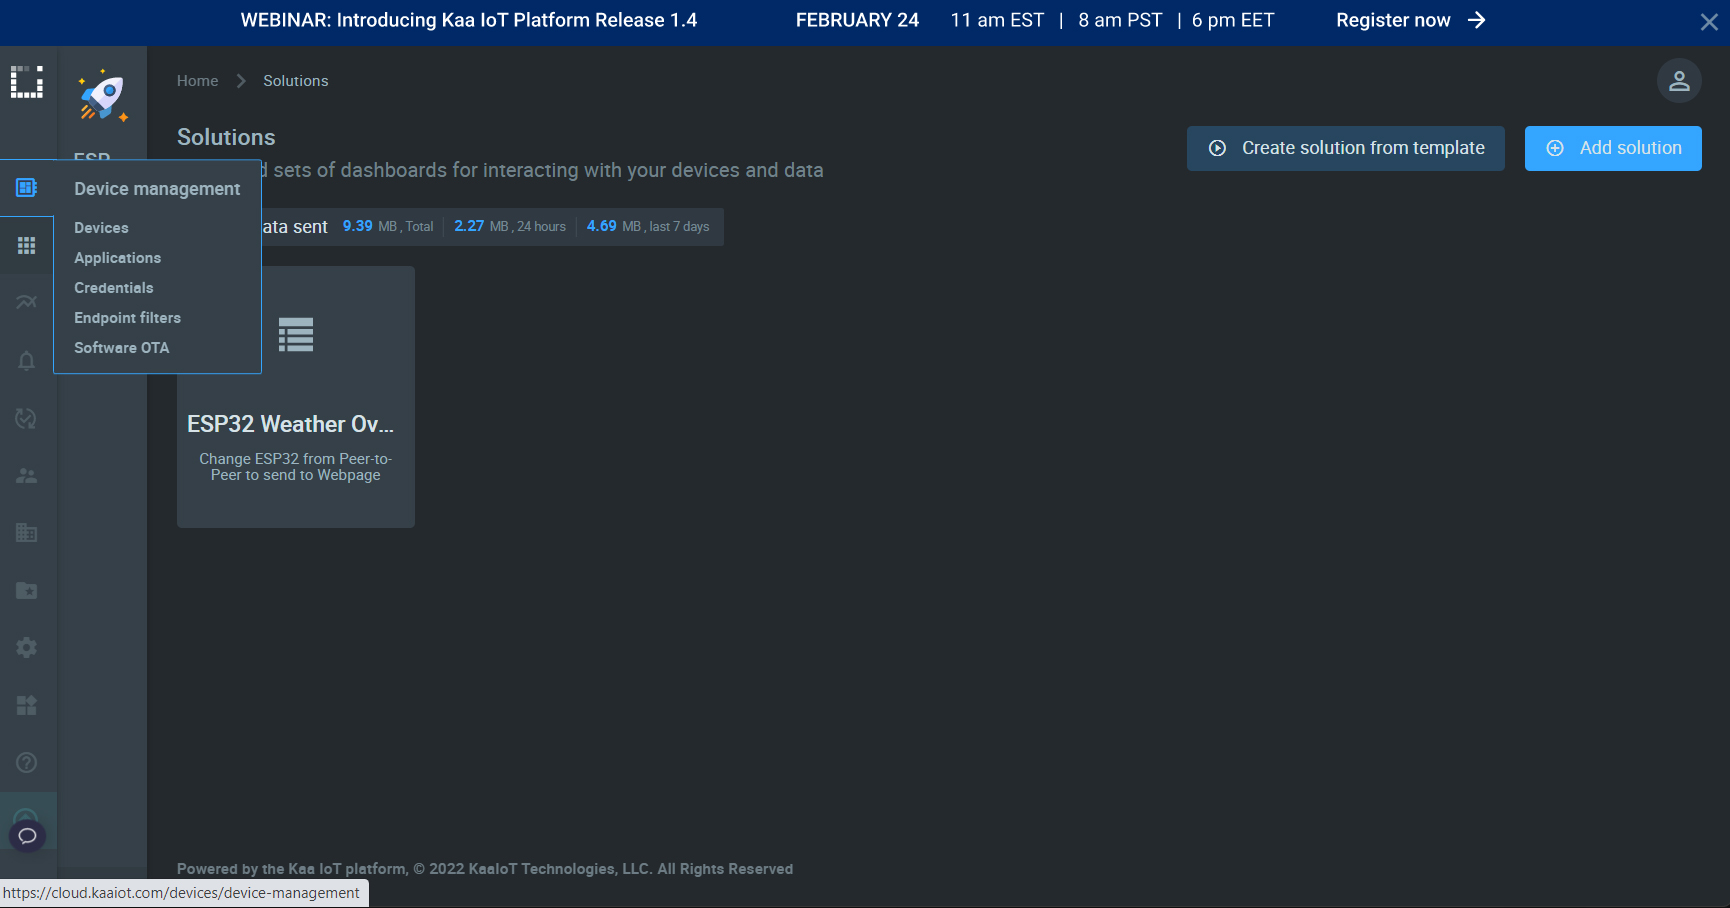
By navigating to the Device Management/Devices page on your KaaIoT page, you’ll be able to verify that the sensor data is being received. KaaIoT has some auto detectors for things like temperature, humidity, and barometric pressure.

Now that we have verified that our sensor is reading data, our ESP32 is sending data, and our dashboard is receiving data, it's time to decide how we want to display that data.
Step 3: Fine Tuning Your Dashboard
One of the reasons I went with KaaIoT for this build was the wide variety of pre-existing widgets available to display your information. Here, we'll set up a dashboard to read your incoming data in an easy-to-read and visually interesting way!
- If you go to the left side of your screen and click on Solutions, it will bring up a screen with all of your projects on it, although at this point you should only have one. Select your solution.
- You should then be on a screen that contains all of your dashboards for the current project. (Again, at this point, you will have only a single dashboard, named “Home”). Select that dashboard.
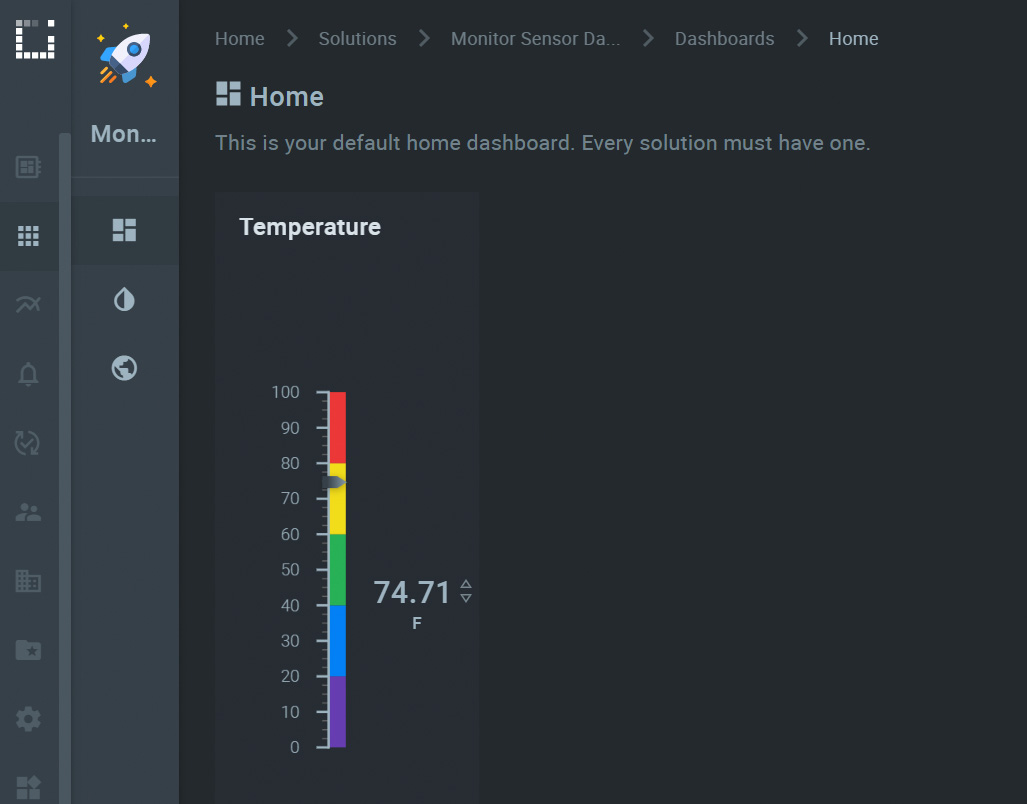
- That will bring you to your primary dashboard, which you’ll notice is currently empty. Click on the large "Add Widget" button on the left of the screen and start with a widget to display our temperature.
- Choose one of the Gauges widgets. I went with a Vertical Bold gauge.
- You can edit this widget in the upper right hand corner by clicking on Edit. This will allow us to insert the proper information, data, and look that we want. I’ve listed the values I used for everything in the table below. Some, like the Application Name and Endpoint ID, will need to be specific. Most of them, however, are open to allow you to tweak your display however you want.
| EDIT WIDGET | |
|---|---|
| Widget Decoration | |
| Title | Temperature |
| Display Header | X |
| Use Transparent Backgound | |
| Display Icon | |
| Z Index | |
| Easy Load | |
| Hide Based on Condition | |
| Data Source | |
| Service Instance Name** | epts |
| Application** | Your named Application |
| Endpoint ID** | Your Endpoint ID |
| Time Series** | auto-temperature |
| Time Series Value** | values.value |
| Reference Timestamp | Latest |
| Update Interval | 1 seconds |
| Variables | |
| Appearance | |
| Gauge Type | Verticle Bold |
| Precision | 2 |
| Postfix | F |
| Gauge Scale | |
| Lower Boundary | 0 |
| Upper Boundary | 100 |
| Step | 10 |
| Color Coding | |
| Base Color | Red |
| Thresholds | |
| ABC <= | 20 / Violet |
| ABC <= | 40 / Blue |
| ABC <= | 60 / Green |
| ABC <= | 80 / Lemon |
| ABC <= | 100 / Red |
Once you’ve got your widgets looking the way you want, you can finalize them by clicking on the “Publish Changes” button on the upper right corner of your screen. Clicking on Edit Mode (or the Lock Slider next to it) locks down your dashboard. You can now see your data from anywhere in the world you can connect to the web. I also pulled up the KaaIoT website on my phone, and found it completely viewable and workable that way as well, even allowing me to easily edit my widgets!
Troubleshooting
Hopefully you won't run into any real issues on this build, but if you're anything like me, you can always find someplace to drop a random bracket or semi-colon that has you scratching your head. Here are some potential spots to check of everything isn't operating the way you would expect.
If you're not getting any sensor readings in the Arduino Serial Monitor, then you'll probably be getting an indication that the Environmental Sensor isn't communicating. You'll get a message that reads something like "The sensor did not respond. Please check wiring." If you're not connecting to the WiFi, you should see a message in the Serial Monitor that reads something like "Connecting to
Beyond that, everything should be pretty straightforward. I did occasionally have trouble editing the widgets in the KaaIoT dashboard. Clicking in the upper right hand corner of each widget would not offer me the Edit/Clone/Delete options, but rather would just act as if I had left clicked on the widget itself, as if I wanted to drag it to a new position on the screen. The workaround I found for this was to hold down my left mouse button outside of the widget, drag it over the upper right hand corner of the widget, then use the touchpad on my laptop to left click. This wasn't an issue every time, but I did see it on both my laptop and desktop.
If your product is not working as you expected or you need technical assistance or information, head on over to the SparkFun Technical Assistance page for some initial troubleshooting.
If you don't find what you need there, the SparkFun Forums are a great place to find and ask for help. If this is your first visit, you'll need to create a Forum Account to search product forums and post questions.
Going Further
The simplest way to take this project further is to start choosing more sensors from our ever-expanding line of Qwiic sensors. You could also expand the project so that you not only read incoming sensor data, but send commands to your project as well. Is the humidity getting too high? Flip the relay that turns on your dehumidifier. You know, the one on the other side of the world. KaaIoT is currently developing an Android app, but maybe you want to expand on that, of build one for the iPhone. The expanse of WiFi and IoT is virtually limitless, and now that you have the building blocks, your projects can soar over seas!
If you want ideas on what Qwiic components to add to your project, here are some of our more popular sensors.