Photon Remote Water Level Sensor
Setting Up the ThingSpeak Channels
The Telemetry Channel
There are many sites out there for storing your IoT data. Here are two: dweet.io and my personal favorite, The Mathworks' ThingSpeak. ThingSpeak already has some nice built-in features, like Google visualization plugins, Twitter interfacing, React (which can do something like post a tweet when data meets a threshhold), MATLAB analysis, and more. It's also open-source.
First, sign up for a ThingSpeak account if you don't already have one. Next, create a channel by going to Channels->My Channels->New Channel. Click the checkboxes next to each field (1 through 8) and label them:
- Water Height (inches)
- P (inHg)
- pressure change rate (inHg/min)*10^6
- T (F)
- RH %
- light intensity
- battery V
- battery SOC
Check the box next to 'Make Public' if you want other people to be able to view it without needing the read API key. To finish, click 'Save Channel'.
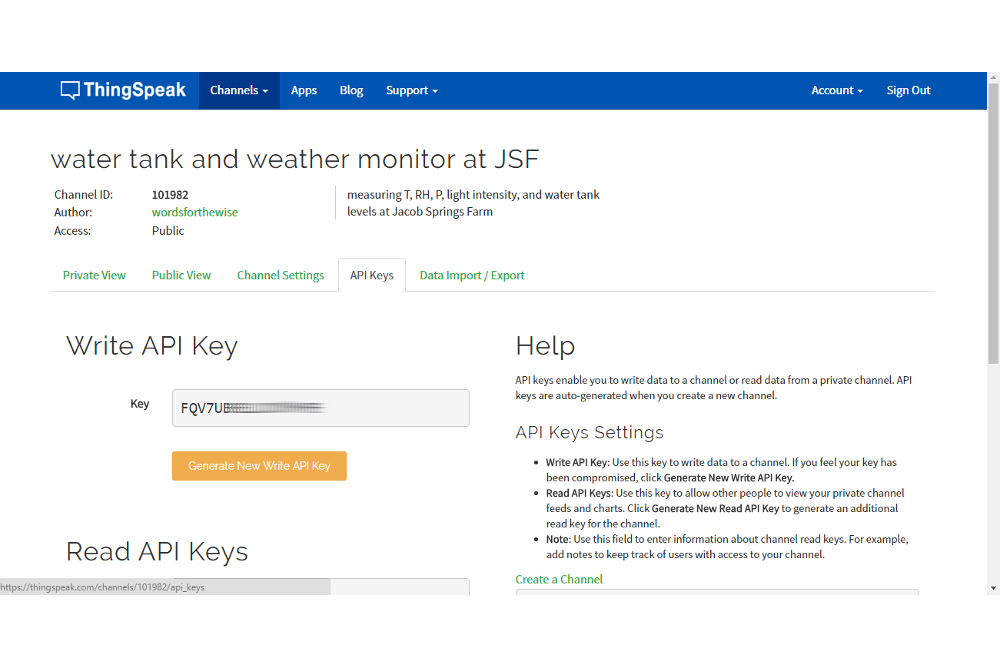
Now, click "API Keys" in the menu bar that should be around the middle of your screen. Copy the "Write API" key, and put that in your Photon telemetry box code as the myWriteAPIKey variable. Also copy the "Channel ID" number from your ThingSpeak channel page, and set that as the myChannelNumber variable in your Photon telemetry code.
Once you power up your telemetry Photon, you should see the data start getting populated (your ThingSpeak page will auto-refresh every 15-ish seconds).
Now, we'll set up a Twitter feed to post info on our data, which can be used to send alerts on rapidly dropping pressure (which can signal bad weather). Create a Twitter account, sign in, and go back to your ThingSpeak page. Click on "Apps" on the top menu bar. Click "ThingTweet", and then "Link Twitter Account".
Once you've linked your Twitter account, go back to the 'Apps' page and click on MATLAB analysis. Use this code, changing the API keys and channel ID for your channel:
language:MATLAB
% Calcuclates the pressure difference over the last 3 hours
% writes to channel as long as the time difference between
% the two points is at least 2 hours

% Channel ID to read data from
ChannelID = 101982;
% Pressure Field IDs
PressureFieldID = 2;
PressureChangeID = 3;

% TODO - Put your API keys here:
writeAPIKey = 'your write API key';
readAPIKey = 'your read API key'; % this is only necessary if the channel is private

% Get humidity data for the last 60 minutes from the MathWorks Weather
% Station Channel. Learn more about the THINGSPEAKREAD function by going to
% the Documentation tab on the right side pane of this page.

[pressure, timestamps, chInfo] = thingSpeakRead(ChannelID, 'ReadKey', readAPIKey,  'Fields', PressureFieldID, 'NumMinutes', 180);

[m,n]=size(pressure)
display(m)

if m > 1 % we need at least 2 points to do the calculation
    % Calculate the pressure change
    pressureChange = pressure(end)-pressure([1]);
    % pressure(end) gets us the most recent pressure reading, which is last in the pressure variable (a Matlab matrix)
    display(pressureChange, 'pressure change (inHg)'); % this shows up below when you hit run
    timeDiff = minutes(diff([timestamps([1]), timestamps(end)])); % difference in minutes between the first and last readings
    display(timeDiff);
    pressureChangeRate = pressureChange/timeDiff * 1000000;
    display(pressureChangeRate, 'pressure change rate (inHg/min)*10^6');


    % Write the average humidity to another channel specified by the
    % 'writeChannelID' variable

    % Learn more about the THINGSPEAKWRITE function by going to the Documentation tab on
    % the right side pane of this page.
    if timeDiff > 60.0 % make sure the time difference is at least 1 hour between the points
        for n=1:8 % quite a bit of a hack, but it works
            pause(2); % they don't allow more than 2s pauses (delays) here, and I didn't take the time
            % to figure out how to do a callback, etc
        end
        thingSpeakWrite(ChannelID, pressureChangeRate, 'Fields', PressureChangeID, 'writekey', writeAPIKey);
        display('writing to channel')
    end
else
    display('not enough data in channel yet')
end
Make sure to hit 'save and run', and you can check the output below the code area to see it working. Scroll down a bit, click "React", then set up a react to run on new data insertion. The picture below shows the details for the react, which are:
| Option name | Value |
|---|---|
| React name | calculate pressure rate of change |
| Condition type | Numeric |
| Test frequency | On Data Insertion |
| Condition: If channel | (your telemetry channel name) |
| Condition | field: 2 (P (inHg)); Is greater than; 0 |
| Action | MATLAB analysis |
| Code to execute | Calculate Pressure Change |
| Options | Run each time condition is met |
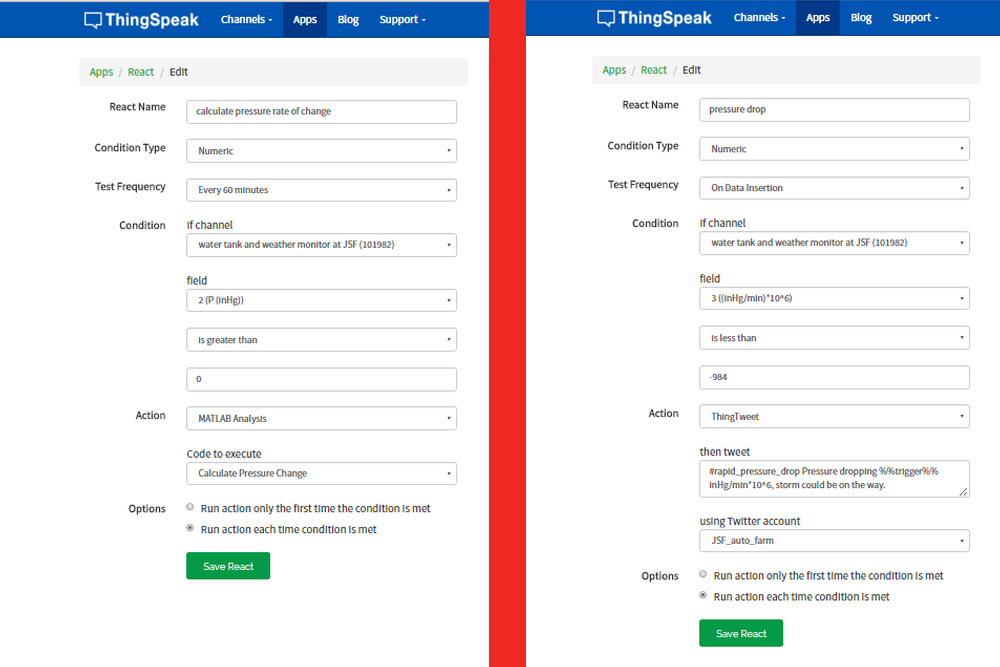
Finally, go back to 'Apps' one more time to set up some Twitter alerts. Click on 'React' and then 'New React'. Set the values as shown in the picture above, and the table below:
| Option name | Value |
|---|---|
| React name | pressure drop |
| Condition type | Numeric |
| Test frequency | On every 60 minutes |
| Condition: If channel | (your telemetry channel name) |
| Condition | field: 3 (pressure change rate (inHg/min*10^6); Is greater than; 984 |
| Action | ThingTweet |
| then tweet | #rapid_pressure_drop Pressure dropping %%trigger%% inHg/min*10^6, storm could be on the way. |
| Using Twitter account | (your twitter account here) | Options | Run each time condition is met |
The %%trigger%% is replaced by the value of the field. Hit 'Save React,' and you're good to go.
The Control Box Channel
Set up another ThingSpeak channel, with just two fields set as:
- pump on
- motion detected
The API keys from this will be used in the control box Photon code.
ThingSpeak Google Gauges
Another nice feature of ThingSpeak is the ease with which nice looking graphics can be made (once you get the hang of it). For example, a Google Gauge can be embedded in your ThingSpeak channel (or anywhere else with JavaScript). Unfortunately, ThingSpeak recently disabled JavaScript apps from being on public pages, so this will only work on private views or other custom applications.
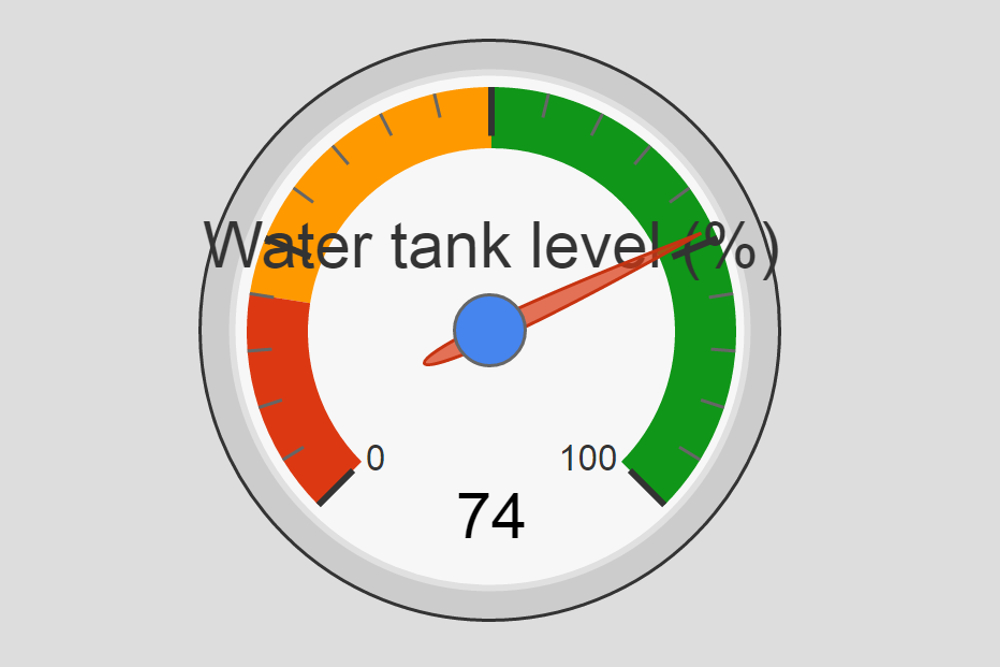
To get this gauge going for the water tank fullness, go to ThingSpeak.com, click Apps->Plugins->New->Google Gauge->Create, and use this code for the JavaScript:
language:javascript
<script type='text/javascript' src='https://ajax.googleapis.com/ajax/libs/jquery/1.9.1/jquery.min.js'></script>
<script type='text/javascript' src='https://www.google.com/jsapi'></script>
<script type='text/javascript'>

  // set your channel id here
  var channel_id = channel ID here; // eg 101992
  // set your channel's read api key here
  var api_key = 'your readAPI key here';
  // maximum value for the gauge
  var max_gauge_value = 42; // this is the maximum water height from your telemetry code
  // name of the gauge
  var gauge_name = 'Water tank level (%)';

  // global variables
  var chart, charts, data;

  // load the google gauge visualization
  google.load('visualization', '1', {packages:['gauge']});
  google.setOnLoadCallback(initChart);

  // display the data
  function displayData(point) {
    data.setValue(0, 0, gauge_name);
    data.setValue(0, 1, point);
    chart.draw(data, options);
  }

  // load the data
  function loadData() {
    // variable for the data point
    var p;

    // get the data from thingspeak
    $.getJSON('https://api.thingspeak.com/channels/' + channel_id + '/feed/last.json?api_key=' + api_key, function(data) {

      // get the data point
      p = data.field1;

      // if there is a data point display it
      if (p) {
        p = Math.round((p / max_gauge_value) * 100);
        displayData(p);
      }

    });
  }

  // initialize the chart
  function initChart() {

    data = new google.visualization.DataTable();
    data.addColumn('string', 'Label');
    data.addColumn('number', 'Value');
    data.addRows(1);

    chart = new google.visualization.Gauge(document.getElementById('gauge_div'));
    options = {width: 200, height: 200, redFrom: 0, redTo: 20, yellowFrom:20, yellowTo: 50, greenFrom: 50, greenTo: 100, minorTicks: 5}; // customize the red, yellow, and green levels if you want

    loadData();

    // load new data every 15 seconds
    setInterval('loadData()', 15000);
  }

</script>
Don't forget to change the \<title> in the HTML section. Then simply click checkboxes on the channels for which you want the Gauge to be visible. You can drag and drop the Gauge (while viewing the channel) to be anywhere on the page.