Servo Trigger Programming Guide
 Byron J.
 Getting Started
The Atmel debug tools are very convenient, but they require detailed configuration to get working. This page will walk you through creating a brand new project and getting the debugger talking to the Servo trigger.
Hardware Configuration
The Servo Trigger has the standard 6-pin in-system programming (ISP) connector.
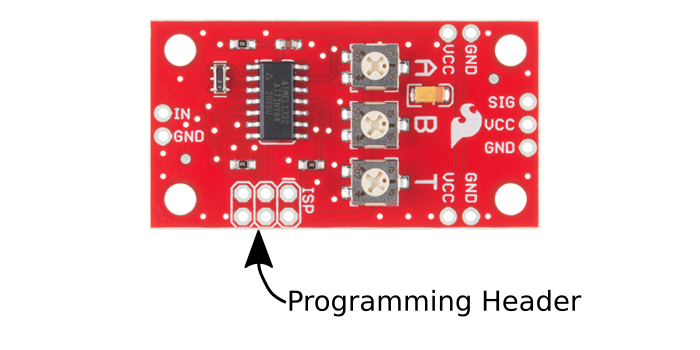
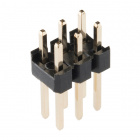
In order to connect to this header, you can solder a header to the PCB or use a pogo pin adapter.
Finally, the debug interface box isn't designed to serve as a power supply for the board. You'll need to power the Servo Trigger by applying 5 Volts to its VCC and GND pins.
Creating a New Project
In order to use the debugger, you'll need a project file. Let's create one from scratch.
To create a project, first open Atmel Studio, and select "New Project".

Select the GCC C or C++ Executable Project options.
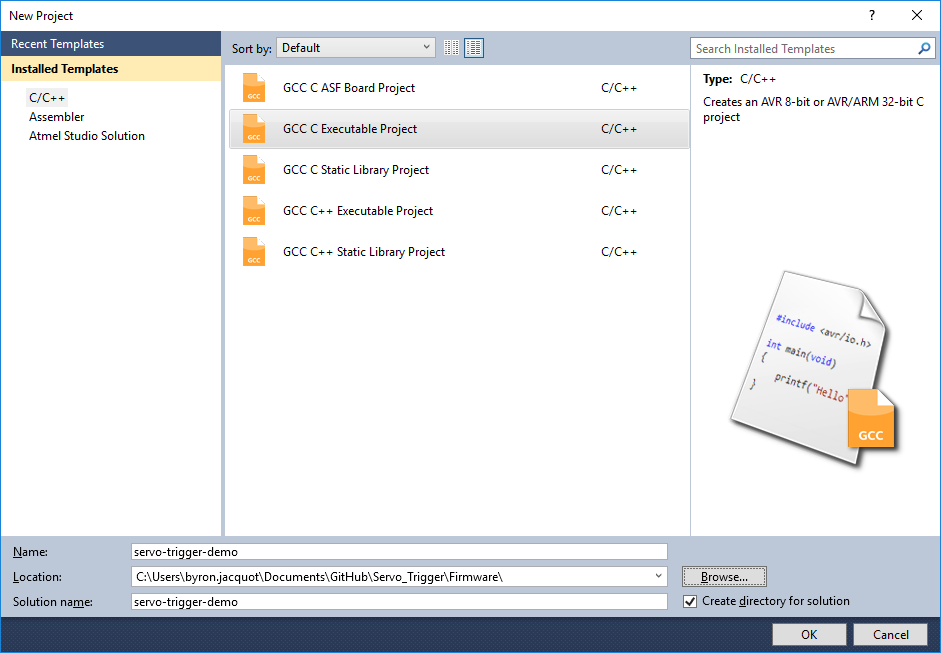
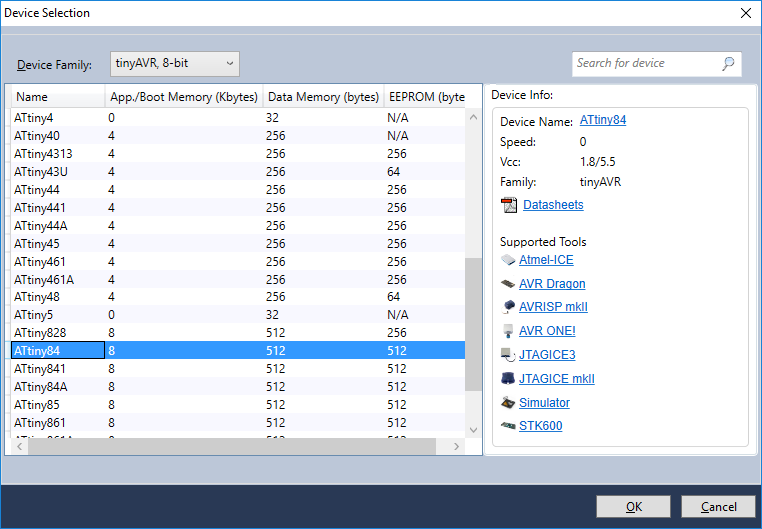
It will take a moment to initialize the project, then show a list of target microcontrollers. Select ATtiny84 from the list.
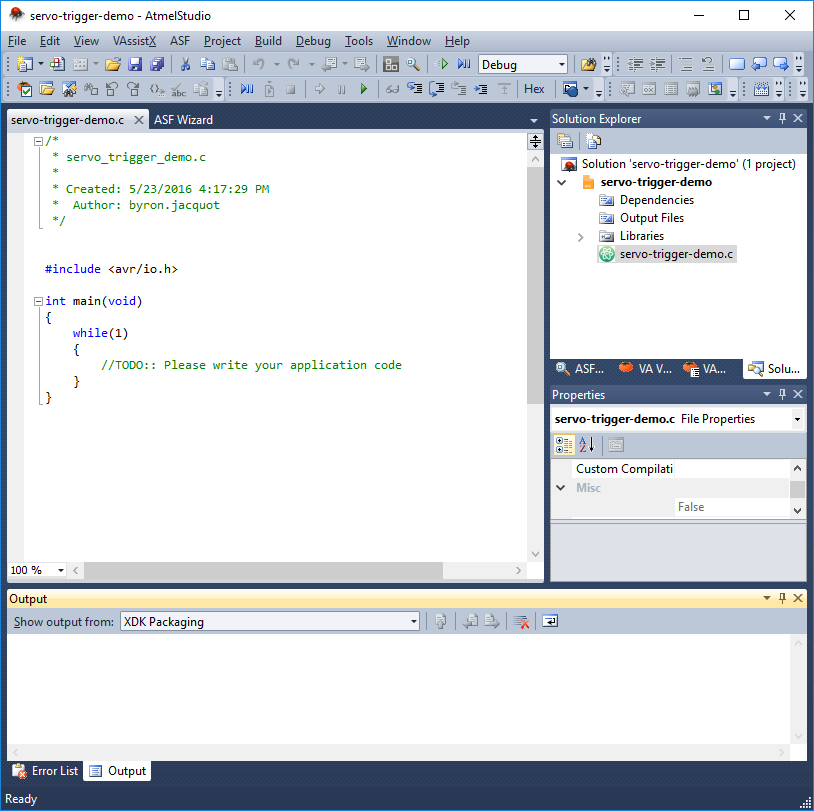
It takes another moment, then comes up with empty project. main() is the entry point for your application.
Programming Interface Modes
Before we go any deeper, lets take a quick break to explore the two modes that the debugger uses to communicate with the chip. While they appear to be similar, they aren't totally equivalent. They're also configured in two places in the IDE, and the settings need to match in order for them to function correctly.
- The first mode is ISP, which uses clock and data signals akin to SPI. It's the older of the two modes, intended to be used to program the flash memory on the processor and interact with some of the low-level nonvolatile configuration, such as the chip ID register and fuse bits. Being low level, it doesn't allow for interactive debugging.
- The other mode is debugWIRE. It was developed more recently, retrofitted into the chips, using communications over the reset pin. debugWIRE can program the flash and allows interactive debugging, but it can't access the ID register or fuse bits.
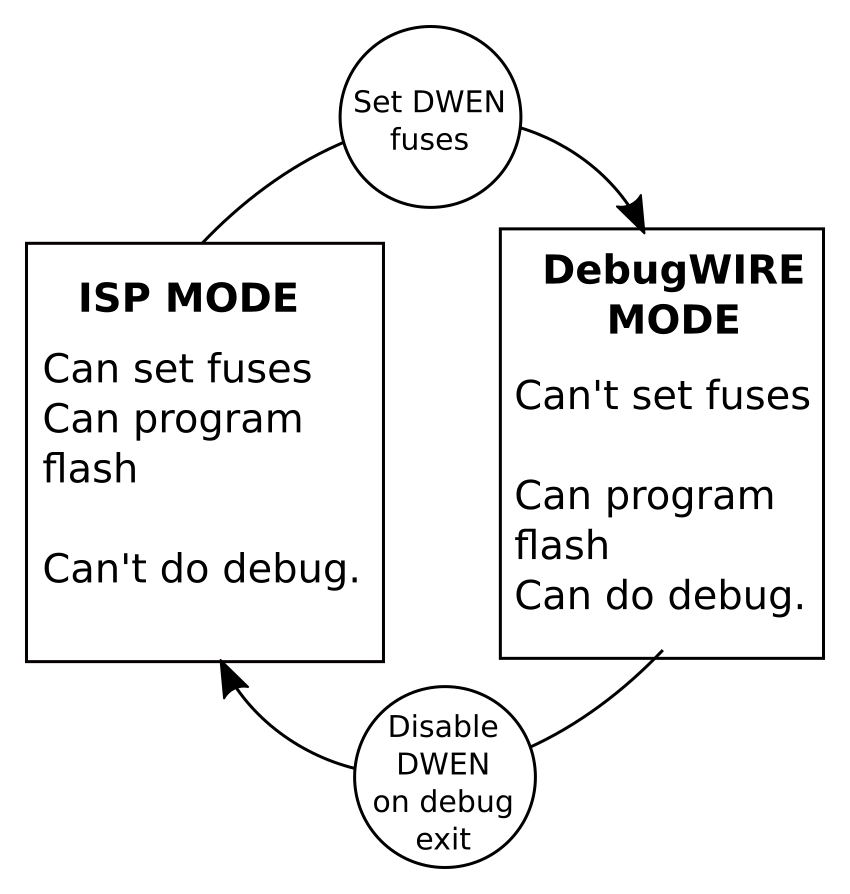
Since neither mode has all of the capabilities, we'll have to switch between them, depending on what we're doing. If you're having trouble using the features of one mode, the most likely problem is that the chip and IDE don't agree on the current mode.
Getting the Interface Talking The First Time
With a new project open in the IDE, connect the debugger module to the USB port.
Click "Project->

Select the connected debugger, and set the interface to ISP.
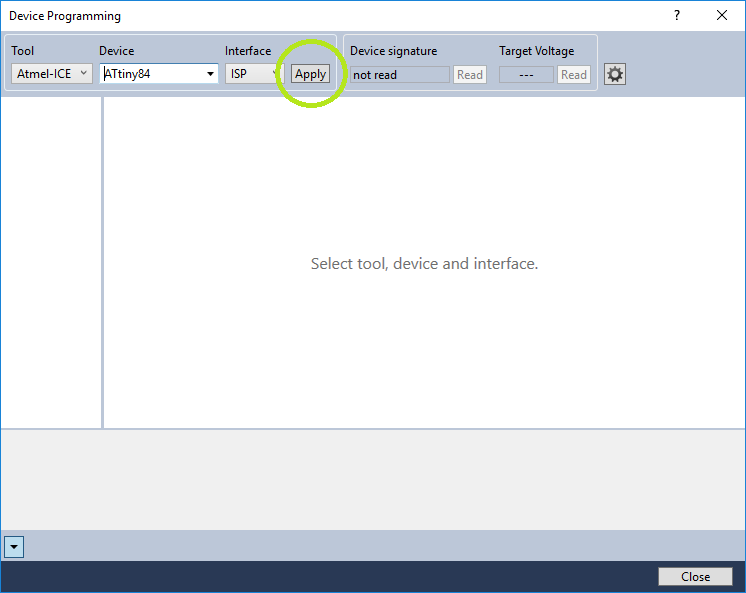
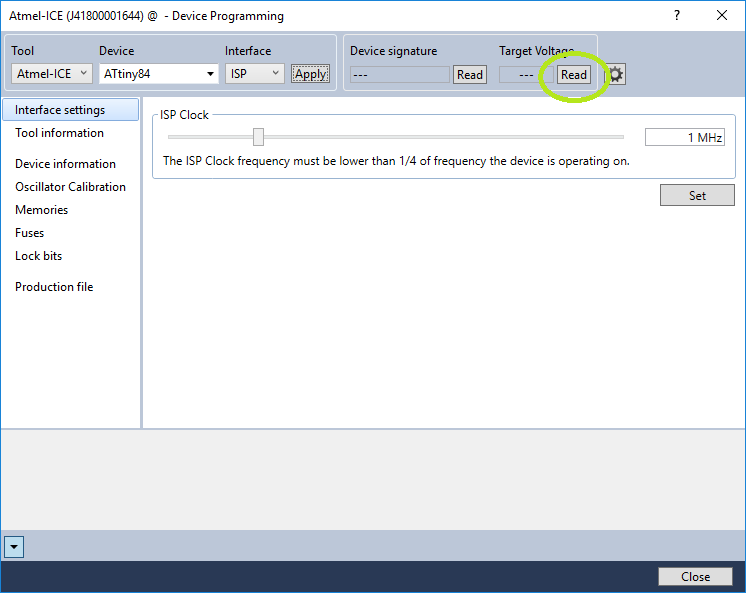
After selecting the interface, click on "tools->device programming" to open the chip configuration dialog. It will open with the tool, target device, and interface selected. Click Apply, and it initializes the interface. More information will appear in the lower portion of the window.
Connect the debugger unit to the servo trigger, and power it up. Click the "Target Voltage Read" button near the top right.
The neighboring box should indicate approximately 5.0V. This verifies that the chip has power and should be able to communicate.
Then, click the "Read device signature" button.
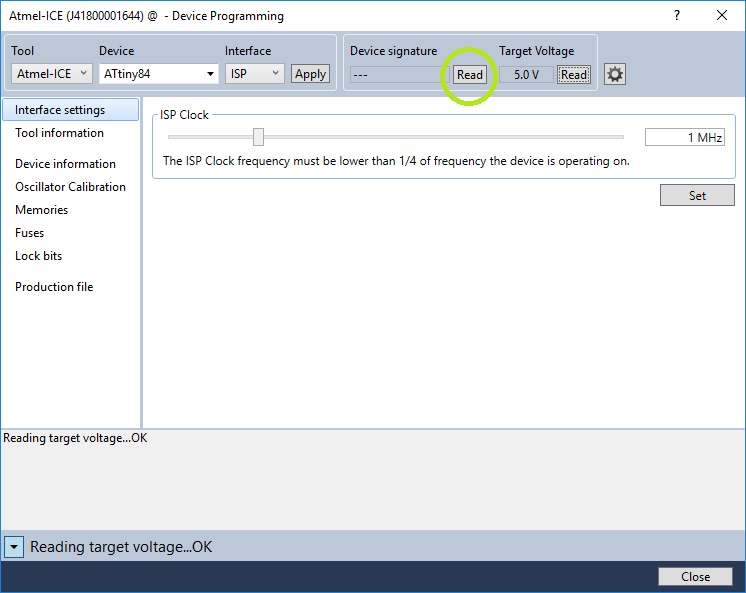
It should report an ID of 0x1E930C in the neighboring box, indicating an ATTiny84.
At this point, we've got confidence that the ISP interface is working, and we can turn on debugWIRE mode.
Enabling debugWIRE
In the Device Programming dialog, click on the "Fuses" tab on the left side of the box. Then mark the box next to the "DWEN" (Debug Wire ENable) fuse. The circle next to the name will turn yellow, to indicate that the bit has not been programmed.
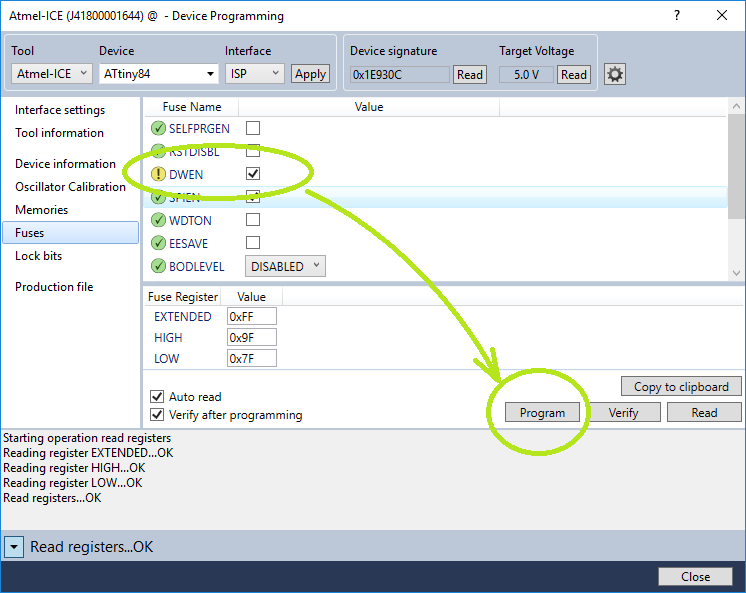
Make sure "Verify after programming" box is checked, then press "program." The progress will be reported in the lower portion of the dialog. If the IDE requests a power cycle of the target, do so. At the end, it should say "Verify registers ...OK", and the circle next to DWEN should turn green.
At this point, close the Device Programming dialog. You should be back at the project properties tab. Now, switch the interface to debugWIRE.
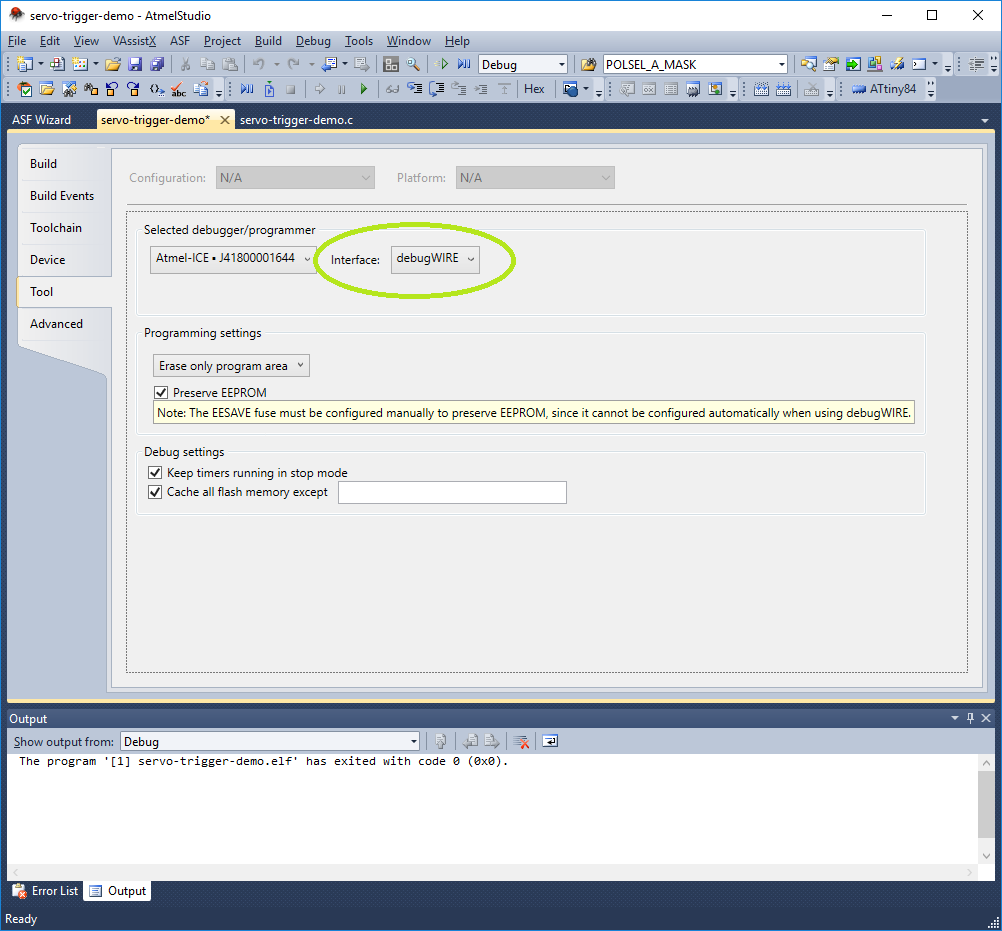
DebugWIRE has been enabled by setting the fuse on the chip, and the IDE has been instructed to use it instead of ISP.
Using Debug Wire
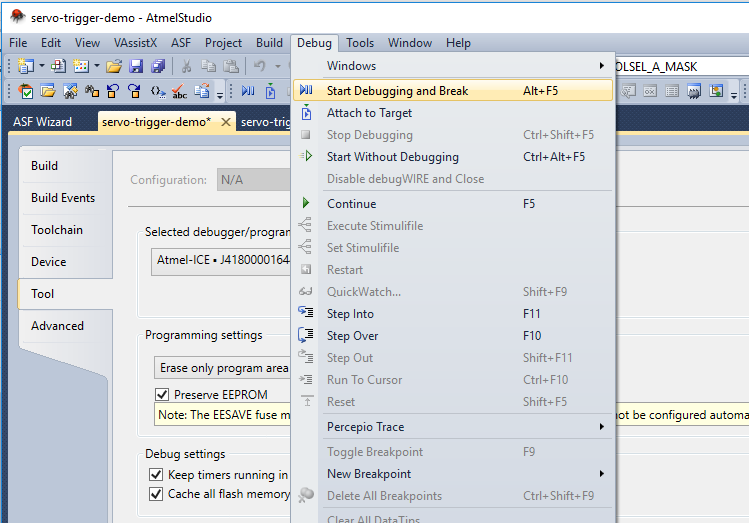
After the steps above have been completed, select Debug->Start Debugging and Break.
The compiler will run, and the IDE will rearrange its windows several times. Ultimately, it will open some memory inspection windows and the source code file.
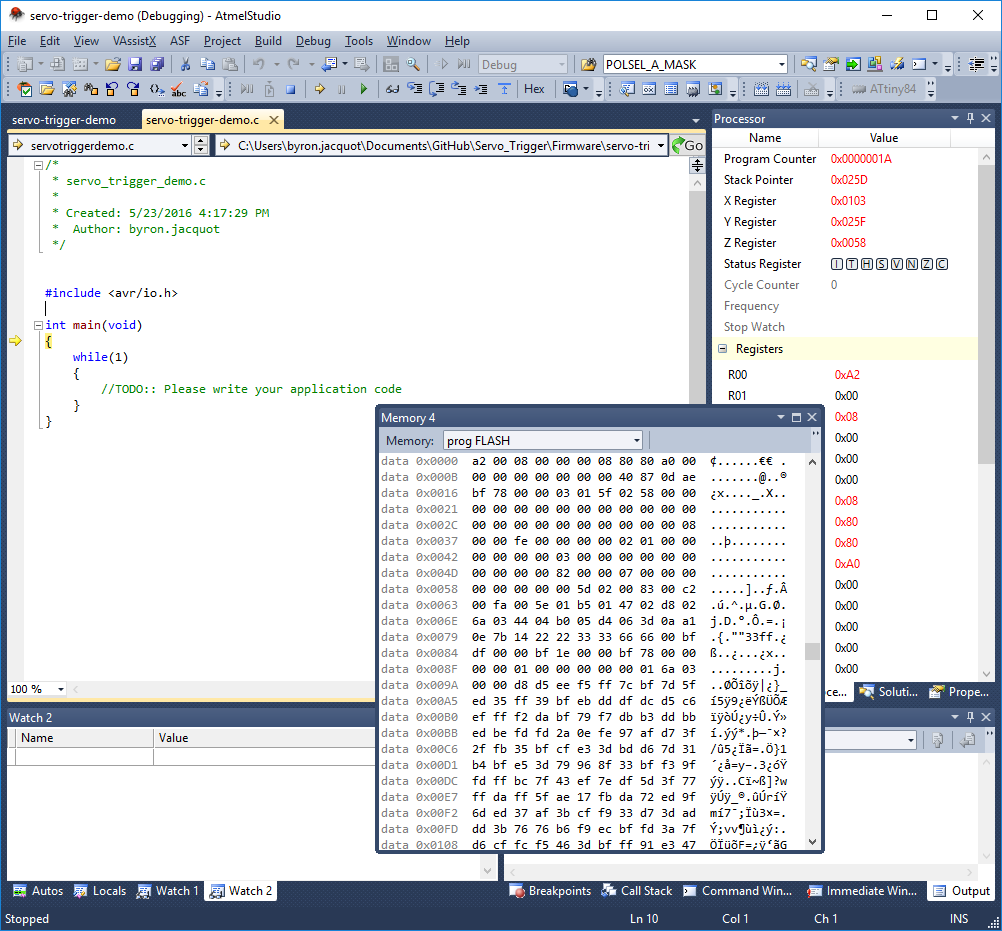
The yellow arrow in the left margin indicates that the debugger is running and has paused at the entry to main().
At this point, Atmel Studio performs like most debuggers. You can set breakpoints on specific lines of code, observe the call stack, inspect variables, and interact with the peripherals by accessing I/O registers in the memory map.
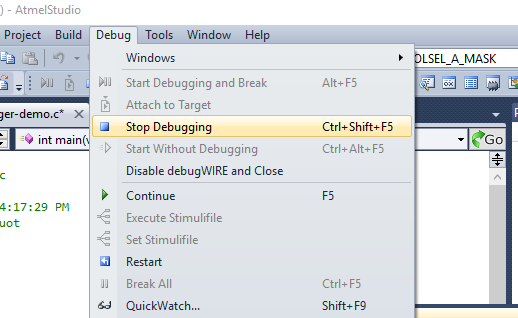
When you're done, select the "debug->stop debugging" option.
The program we've got in the default empty project is pretty trivial -- main contains an empty, infinite loop. If we were developing a more meaningful application, we would be adding more code to the source file, building and debugging as needed.
If you're making round trips from the editor to the debugger and back, stopping debugging is a reasonable way to switch modes.
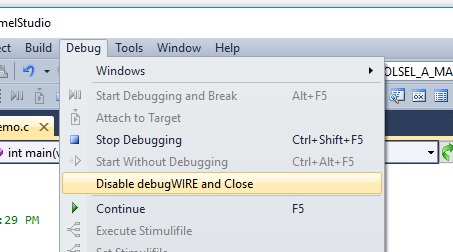
If, however, you need to go back to the Device Programming dialog (for example, to change clock settings or adjust other fuse bits), you'll need to disable debugWIRE when ending the debug session.
This clears the DWEN fuse. You can then return to the first time instructions above. Don't forget that the project configuration and device programming need to both be set to ISP. To return to debug mode, you'll need to set the DWEN fuse again.
When You Get Stuck
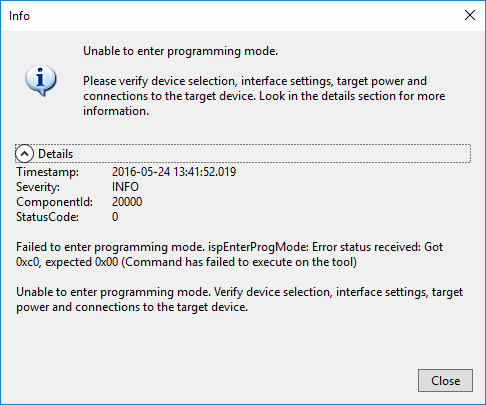
It plays out like this: Yesterday you were debugging, today you start and decide to go and check the chip configuration in the Device Programming dialog.
Nothing works, and the error details contain "Got 0xc0, expected 0x00."
The trick to unjamming it:
- Set the project to debugWIRE.
- Start a debug session (Debug->Start Debugging and Break).
- Once the debugger is initialized, select "Debug->Disable debugWIRE and Close" to get out.
- Set the project back to ISP, and now the Device Programming dialog should be functional.
One Final Warning
Knowing the fundamentals of starting and stopping the debugger, lets look more closely at the Servo Trigger firmware design.