Enginursday: Aquaponics and the Internet-of-Things
A brief overview of the numerous internet-enabled devices I've used to monitor my aquaponic systems.

First off, happy belated Earth Day to all my fellow Earthlings. Earth Day seems to have morphed into Earth Week, and I for one welcome a week-long celebration of our dear planet over something like Spring Black Friday – yeesh.
The aquaponics community has taken note of the growing celebration, and, for the past three years, the Aquaponics Association has hosted the Tour de Tanks, a celebration of all things aquaponics, which takes place the weekends before and after Earth Day.
Image courtesy of the Aquaponics Association.
During this time, aquaponic enthusiasts across the country are encouraged to show off their systems to anyone and everyone who is interested in viewing them. For the second year in a row, I will be hosting a few tours of my own, one of my home systems and one of the Boulder Hackerspace's system. If you are in the Denver/Boulder area, you can find more info about the tours on our Meetup. And, be sure to visit the Tour de Tanks Map above to see if there are any tours near you.
Along with showcasing my systems and their inhabitants, I will also be showing off the many methods for monitoring my aquariums. I will also be highlighting those methods in this blog post in the hopes that, should you be on the fence about starting your own system, this post might help push you closer to making the plunge. Knowing what's happening in your water doesn't need to be a chore. Rather, it should be one more element of the project that draws you to the hobby.
Raspberry Pi
The Raspberry Pi single board computer has been one of the go-to choices for many hobbyists who want to have their project connected to the Internet. The price-point and the vast collection of tutorials available for the Pi alone make it a great choice. On top of that, you can write your software in Python, C, C++, Java, Scratch, and Ruby, giving you many options for how to collect and handle your data. I also enjoy having the option to connect to WiFi or Ethernet.
I currently have two tanks using Raspberry Pis to collect data. The first is connected to the tank housed at Solid State Depot, the Boulder Hackerspace. I highlighted this system in a blog post several months back.
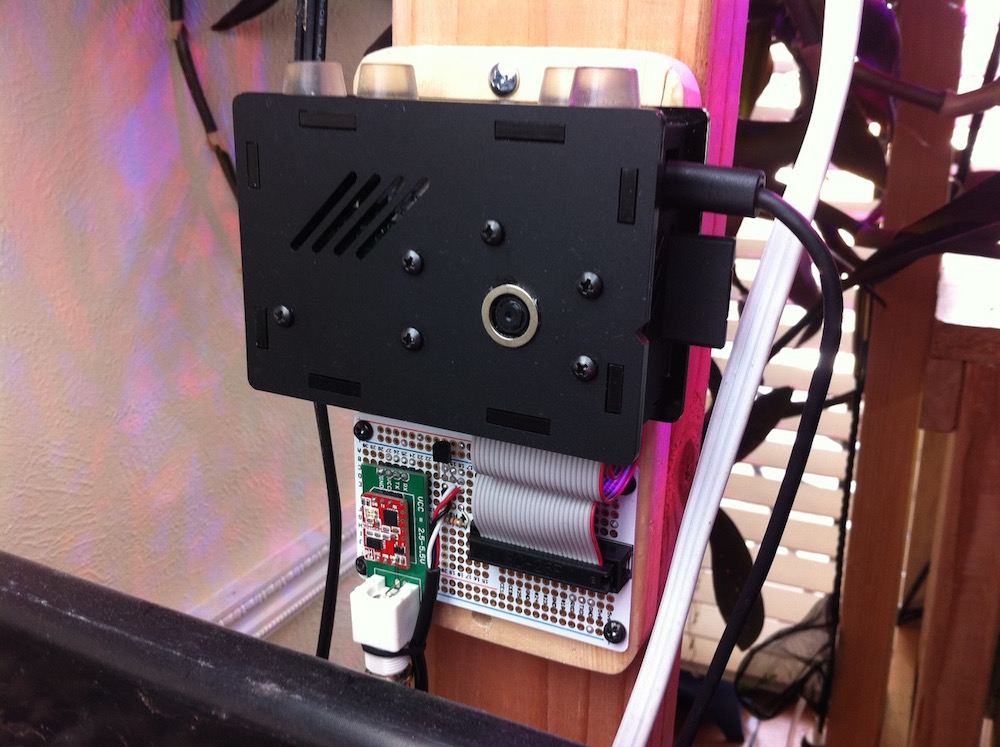
Shortly after that post went live, I created a similar setup for my home system, which houses four tilapia, this time for measuring the water and room temperatures, as well as the pH of the water.
It's been a huge help to not only be able to test the pH of my tank daily, but also to be able to see trends over time, as well as have a visual record of past events such as water changes.
I was worried about the calibration of the probe drifting over time, but after six months it's still producing reliable readings. I check the pH once every few weeks using traditional reagent tests to compare the two, and they remain neck and neck thus far. We'll see how much algea accumulates before it needs to be treated.
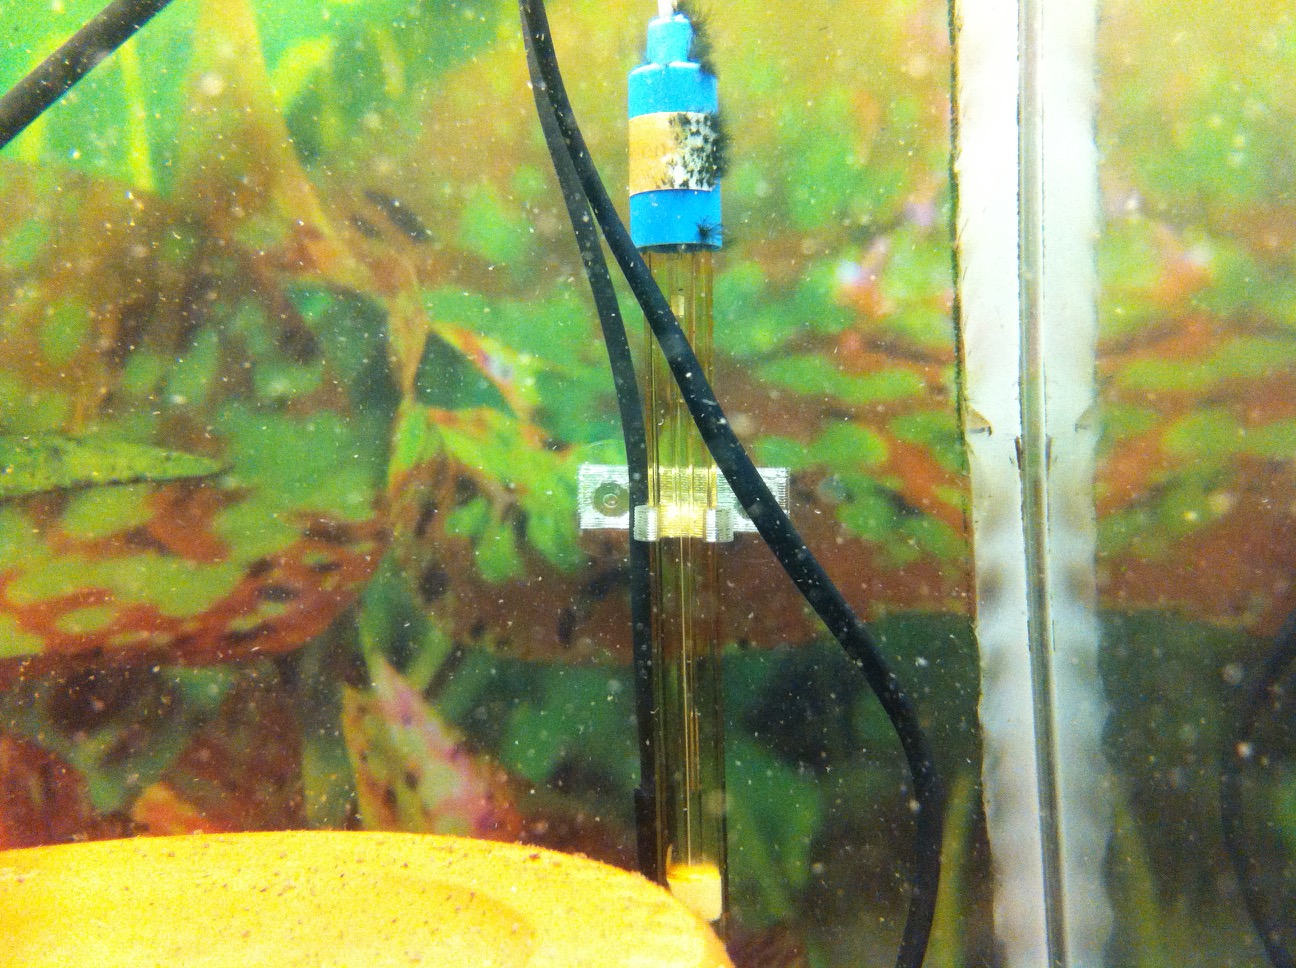
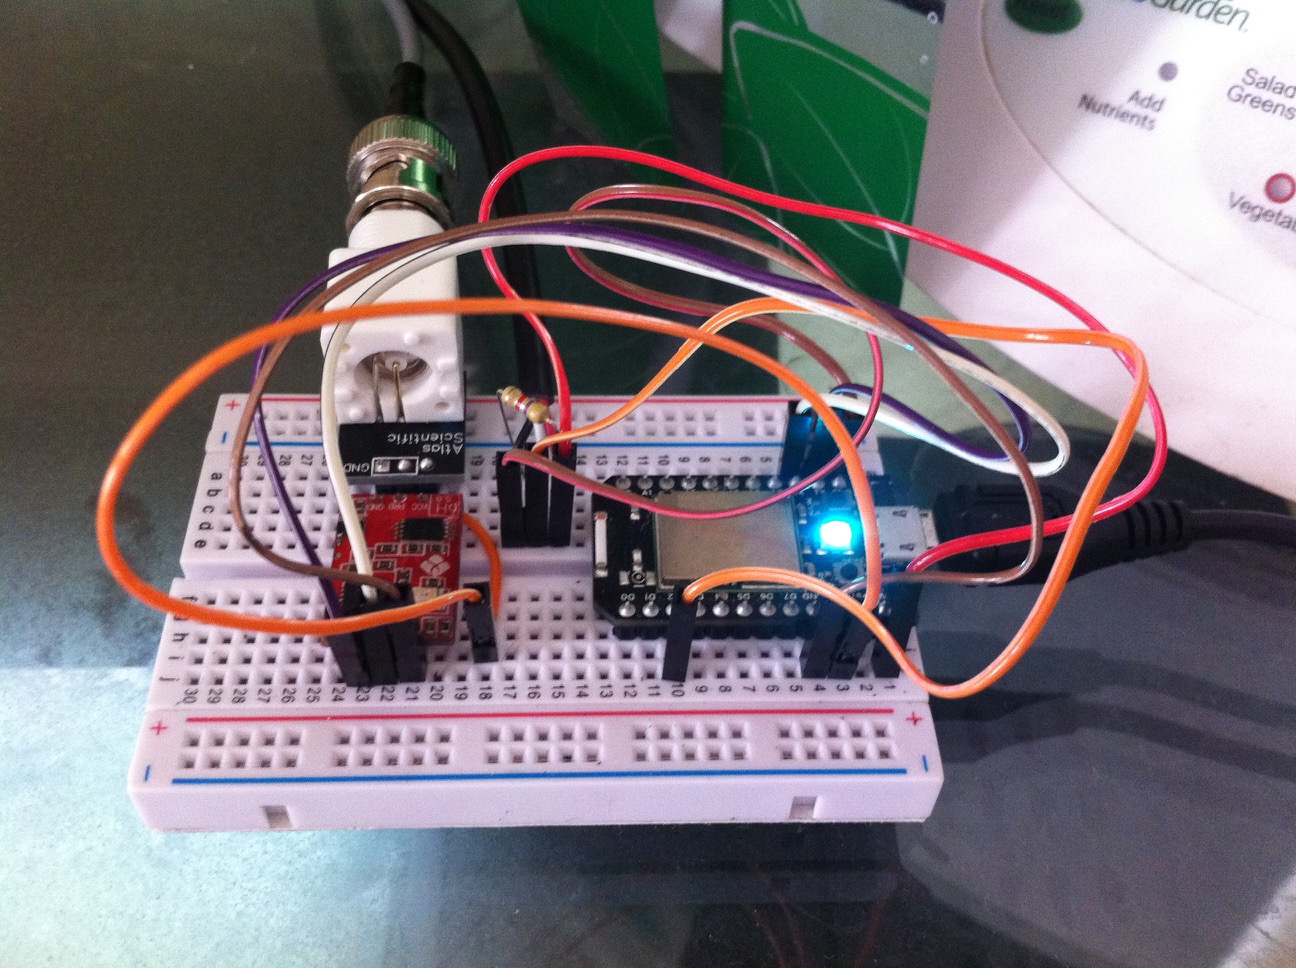
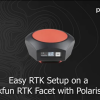
An Atlas Scientific pH Probe and a Waterproof DS18B20 temperature probe held to the side of the tank with a custom 3D printed holder.
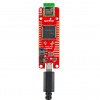
Spark Core
The folks over at Spark.io have created a fantastic product, the Core. And with their next product, the Photon, poised to hit soon with a price point of $20, they are making waves in the IoT realm. I'm currently using two Cores to monitor my 10 gal. aquaponics system and my 60 gal. non-aquaponic fish tank, which houses two cichlids. One of the main appeals for me was the creation of the Spark Channel on the IFTTT web service, of which I was already a user. Now, I can get text message alerts should the tank temperature drift above or below the thresholds I set (you'd be surprised how many tank heaters I've seen malfunction!), and I can now set similar alerts for other parameters such as pH and oxygen levels.
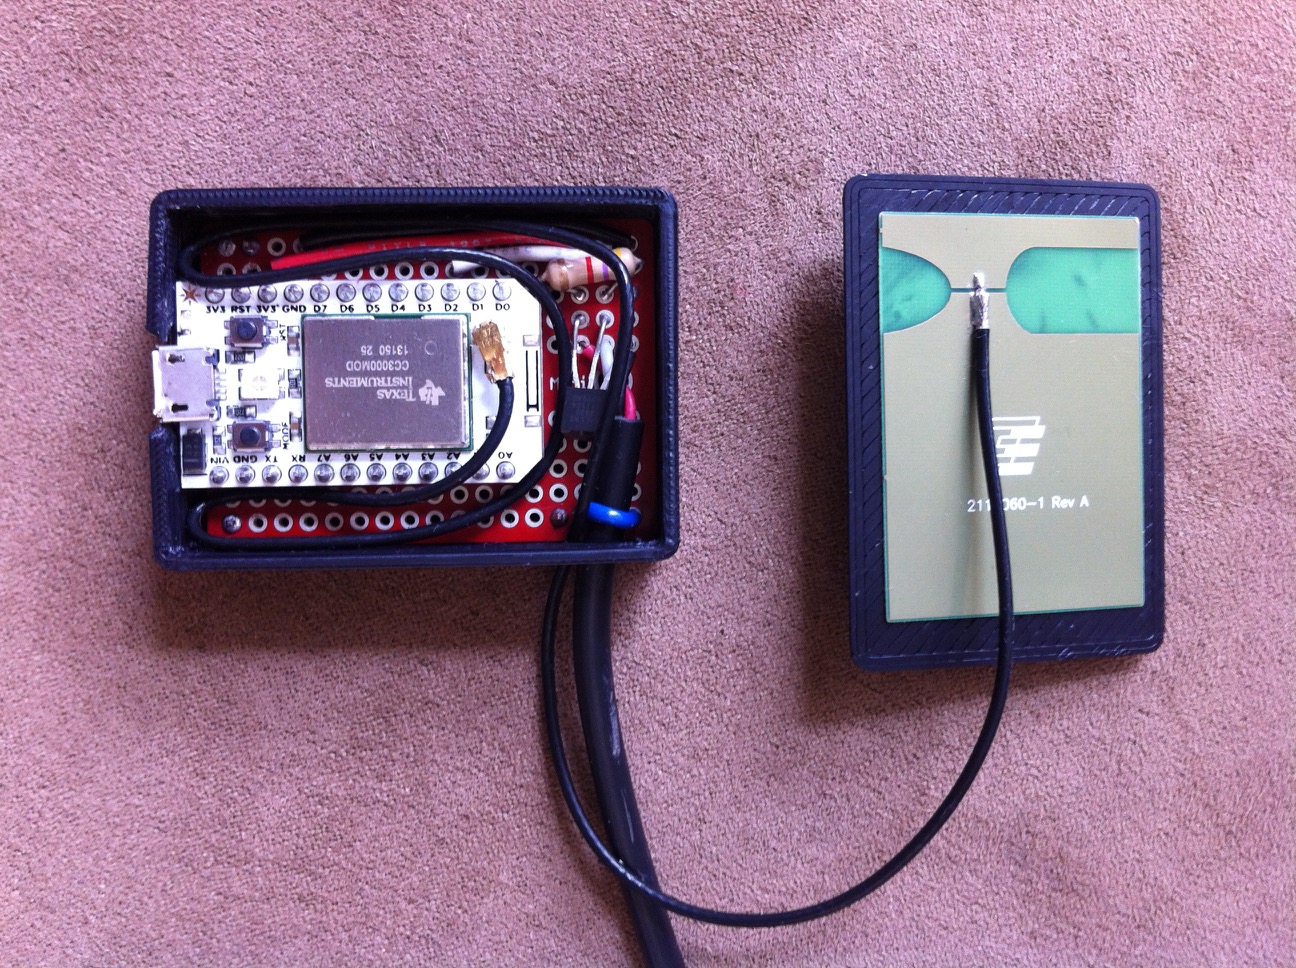
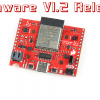
The Core connected to a waterproof and standard DS18B20 temp sensor via a Mini Solder-able Breadboard, housed in a 3D printed enclosure.
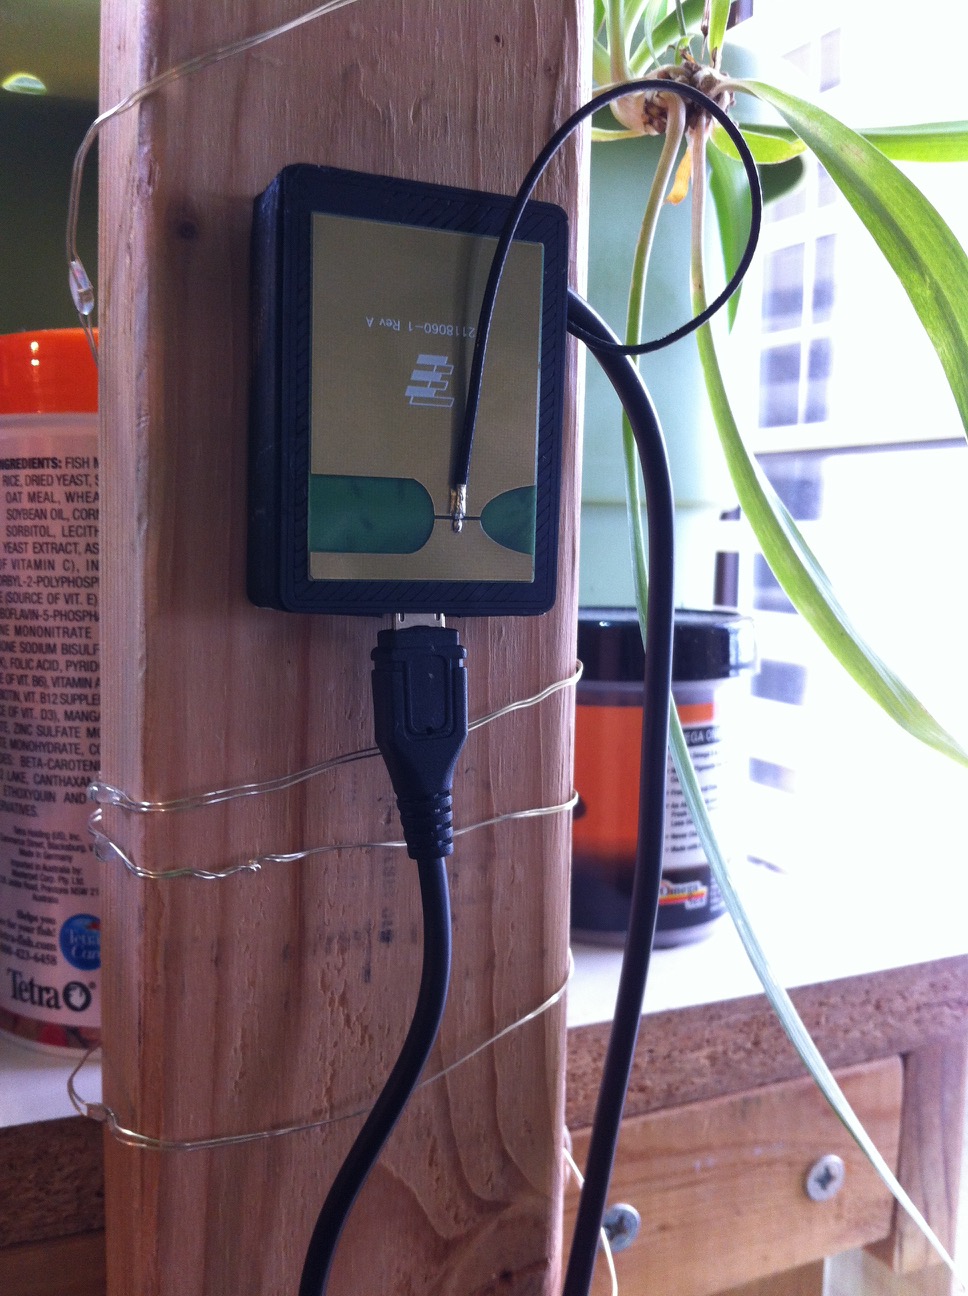
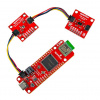
The final enclosed unit mounted near the tank. A 2.4GH adhesive antenna was used to connect the u.FL Core to the web.
I was having some issues with pH crashes in my cichlid tank, so I created a similar setup as the one in the tilapia tank, this time using the Core as the brain to monitor and collect data on the pH in the tank.
I wrote up a full tutorial on the creation of that project over on my website. Thus far, I've been impressed with the Core's performance, and I look forward to incorporating the Core, the Photon and the recently Kickstarted Electron into my future projects.
ESP8266
If you are looking for the cheapest option possible, the ESP8266 WiFi module might be right up your alley. Working with this module requires a little patience and a lot of searching. However, the community for it is growing fast, with numerous articles, tutorials, and even its own IDE.
I haven't directly integrated it into one of my systems yet, but it's next on my to-do list. I currently have a MicroView pulling in weather data via an 8266, so it's only a matter of time before I'm pushing data out.
Visualizing Your Data
I've primarily been using Google Charts to graph my data.sparkfun streams. I have a page on my site dedicated to housing all my tank information in one place. It works well on my mobile phone, and it plays nice with most browsers. The one downfall is long load times when looking at long time periods.
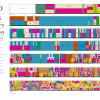
Recently, I began using Analog.io to visualize my data. One of the great features of using that site is being able to pull multiple streams into one graph using the collections feature. And having a wider variety of time frames in which to see your data makes for easier trend spotting.
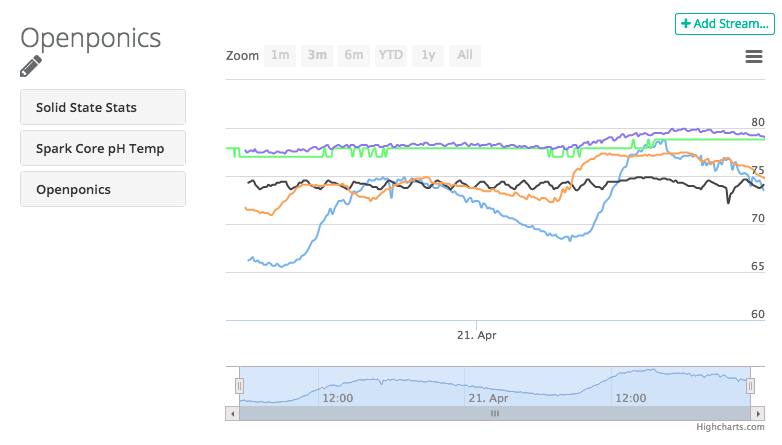
Five different temperature collections viewed on one Analog.io graph.
No matter which of the numerous methods for collecting or visualizing your data you choose, the important thing to take away is that all the buzz around IoT and Big Data can help us on small, individual levels. It helps make the aquaponics hobby that much more scientific and documentable, and it's not just for the fishes. Humanity can and is using this new set of data collection tools to make scientific discoveries and hypotheses, to see trends and new patterns in life. We can use these tools to help us better understand this Earth we live on and the creatures we interact with on a daily basis. But, it's up to us to choose how we use those tools.
This is Luke from analog.io. I'm excited to see Joel's mention of our site! I'm still putting together some high level marketing pages but basically analog.io is a visualization tool for data that is stored on data.sparkfun.com. you can simply tell analog.io your data.sparkfun.com public key and it will automatically plot the data for you.
If you would like to view the live collection of data, you would first need to create an analog.io account and then you can view the following link: https://analog.io/#/cG
this is my diy aquarium controller project.
http://reefcentral.com/forums/showthread.php?t=2332822
Very impressive. Thanks for sharing!
I'm having issues logging to data.sparkfun. It seems like anybody serious about using it is either putting data in so frequent that the time isn't important, or they have their own time stamp. Why is the auto time stamp so useless?
My posts are appearing and the time stamp seems to be sufficient for the use, but I'm not familiar with the format and it seems to be the time for New Zealand. I have nothing against New Zealand, and I am sure the format has a lot of benefits. I would like to learn why it is what it is.
Ah yes, the format does take some getting use to. It defaults to the timezone you're seeing because the service can't assume what timezone you'll be in, so it needs to be told. You can add code to your HTTP requests and either do some math on the time or explicitly tell it to fall under a different timezone, such as
&timezone=America/Denver. If you visit my data page, right-click and select view source, you can see how I set that up to display different time frames all using the correct timezone.Thank you JoelEB!
Is the issue that the time stamps are not accurate enough for the data that you are logging? I could see where there may be a few 100 ms of delay from when the data is sent and when it is timestamped. Most of the time that inaccuracy is not critical for the data that I log.
Sorry to hear about your troubles. My very first stream posted it's own time stamp, but I quickly realized the auto time stamp took care of that for me. It's convenient for devices like the ESP8266 in that, unlike the Raspberry Pi, which has it's own OS and system time, the ESP8266 would either need to have an RTC module attached or query another website for the time. With the auto time stamp, I can populate my Google Charts along a time plot without needing to program that time collection into my device, all with just a few extra lines of JavaScript.
"(you’d be surprised how many tank heaters I’ve seen malfunction!)" One day my Daughter noticed a strange smell.... looking through the house we found a heater in our Reef tank bubbling.... yup. Insulation broke down and was electrolyzing the salt water.... and electrocuted on of my favorite corals....
Cool, I've considered a leave in PH tester in the past but I've always been concerned with drift as well. So it is definitely nice to see someone else do it first and hear that stability isn't as big of a concern as I had thought it would be.
I've used leave in pH & TDS meters for years in hydroponics w/o issue. I periodically clean the funk off, but it's no big deal.
Joel, Thanks for the post. A I've said before, I'm working on a similar setup. So it's great to see the ideas others have come up with and integrate them into my own system. The 3D printed holder will come in very handy. And I've just begun to think about how best to visualize the data. Google Charts was my first thought, but the link to Analog.io will give me something else to consider.
Great post, and keep us updated as you improve/upgrade the system.
Thanks for the feedback. I will continue to share my aquaponic adventures with everyone.