Enginursday: Automating Greenhouses
Check out the next chapter in the aquaponics automation saga. The project has moved beyond a small indoor system to automating an entire geodesic dome greenhouse full of many different systems.

It has been almost two years since my first aquaponics post, and I have met so many wonderful people and learned so many amazing things in that time. If you've missed any of the previous aquaponics related posts, you can catch up here.
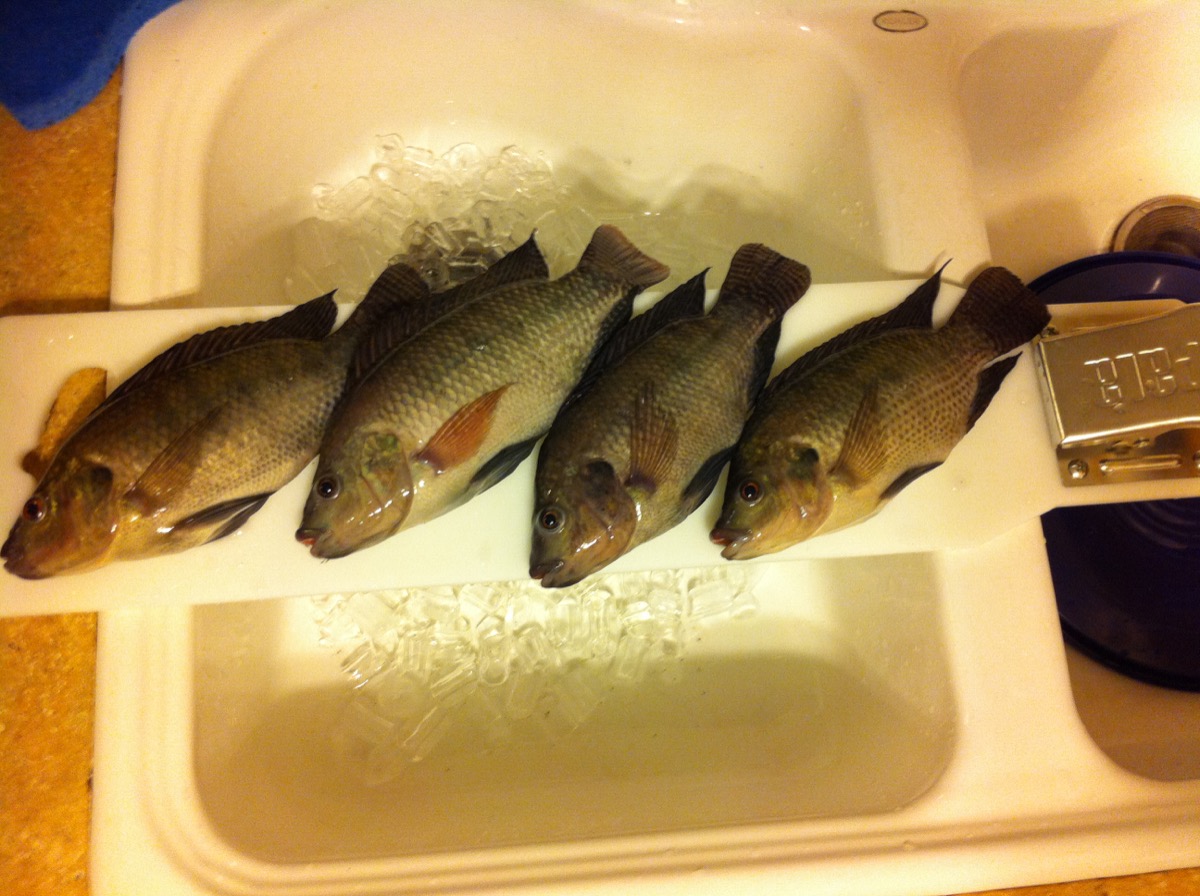
First, a brief update of my personal system. Last month, I had my first Tilapia harvest. It was a difficult yet rewarding task. I would certainly do it again, and I intend to. I ended up with 16 adolescent Tilapia from an unexpected breeding between two of the original four fish. I will likely give several of them away as they outgrow the tank they're in, but having a second generation to raise is a very exciting prospect.
I will be setting up the same system that housed those Tilapia at SparkFun in the near future. It will serve as a showpiece for tours, it will be a platform on which to showcase numerous SparkFun products, and it will be a community garden of sorts for the employees, albeit a small one.
As for aquaponics monitoring and automation, I've been continuing to explore different options for each aspect of a given system. I've been exploring new hardware, trying out many of the new IoT devices, such as the Photon from Particle, and the Intel Edison. Using several of our SparkFun Shields for the Photon, I created a temperature and pH monitor that logs that information to data.sparkfun.com.
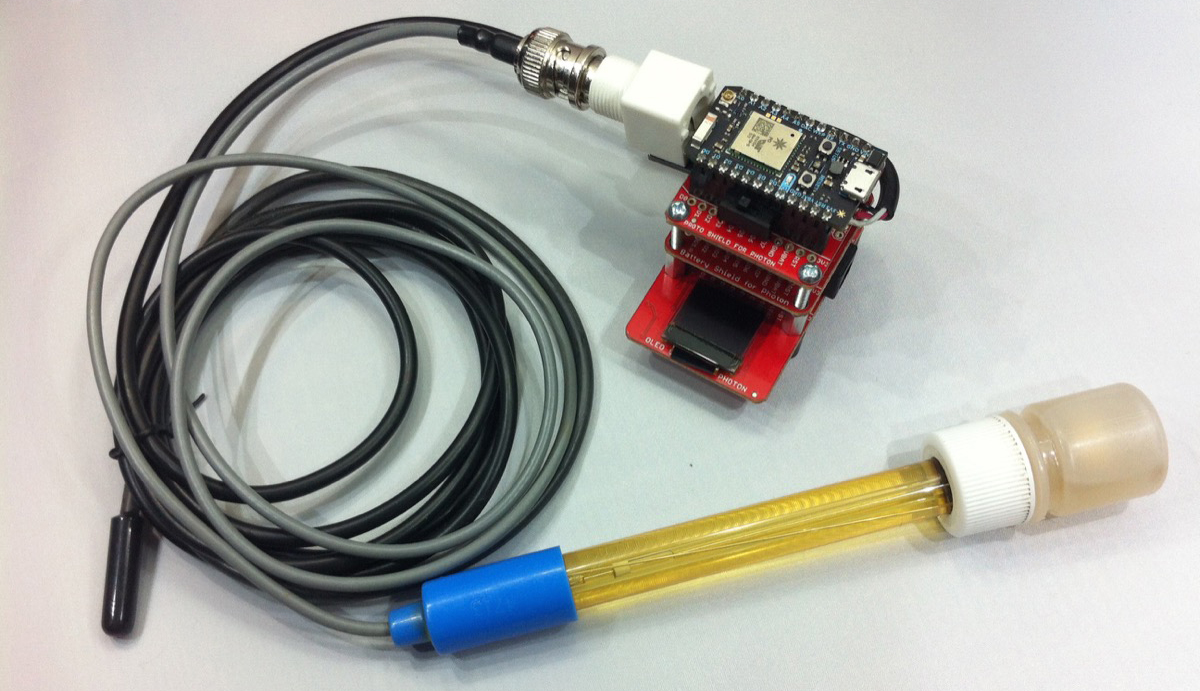
This stack contains a Photon OLED Shield, a Battery Shield for going mobile, and a ProtoShield with an Atlas Scientific pH Stamp, BNC connector and waterproof DS18B20 temp sensor soldered to it.

The OLED screen prints out the current data for at-a-glance updates while also logging the data to data.sparkfun.com periodically.
I've also been trying out different ways of visualizing aquaponic data. Freeboard.io has been at the top of my list for sites to use for data visualization. There are so many IoT devices and services coming out right now. Only time will tell which products and services make the final cut.
Alongside experimenting with new technology, I have also been refining existing technologies to take this hobby to the next level. In April 2013, I met Avery Ellis, founder of Integrated Aquaponics, and he opened my eyes to the world of DIY aquaponics. It was at that moment that I was hooked, and I owe him a lot for all the knowledge he bestowed upon me. Now, two years later, I am able to repay that debt. This past weekend, I was one of many who came out to his house to help in rebuilding his geodesic dome greenhouse. This was the same greenhouse that inspired me two and a half years ago. After moving into a home of his own, it was time to put some serious work in to the dome. I was blown away by the amazing, talented group of people he was able to assemble for this work party. By the end of the weekend, we had finished insulating the bottom portion of the dome, backfilled it, framed a vestibule around the entrance of the dome, and started to layout the inside of the dome.

The next phase will be covering the dome, insulating the North wall, and running all the tubing for water flow and wires for electronics. I will be automating as much of the greenhouse as possible, starting with the louvered greenhouse fan shown in the above photo. Multiple one-wire temperature sensors will be wired throughout different zones of the greenhouse to collect temperature data. Once the collective temperature of the greenhouse gets hot enough, the fan will kick on. This will be just one of many automated features. Parameters such as pH, dissolved oxygen (DO), water temperature, humidity, water levels, CO2, light and flow rate will all be monitored eventually. We will also be measuring the power consumption of the greenhouse as a whole as well as the consumption from individual systems. It is by far the most ambitious monitoring and automation task I have taken on thus far, but it's already been a very rewarding experience. And, we've only just begun.
If you would like to keep up with all that Avery is up to, you can visit his sites:
- Integrated Aquaponics - Aquaponic consultation and design
- Backyard Revolutions - Backyard permaculture
- Colorado Greywater - Consulting, design, & installation for water reuse
Last, if you're in the Loveland, CO area the weekend of Oct. 10-11, be sure to swing by the NoCO Mini Maker Faire. While you're there, be sure visit the SparkFun booth, the Openponics booth, and the Solid State Depot booth.
What are your ideas/needs/desirements for visualization? Have you found your solution? Check out COSMOS. It can log your data and then allow you to visualize it in many ways.
I did look into COSMOS when Toni was writing up the blog post. I'm interested in it, just haven't had time to dig in just yet. Thanks for the suggestion.