Project Highlight: An ECG Analyzer Powered by Edge Impulse
Check out this DIY, TinyML-based electrocardiogram!

The heart is one of the most fascinating organs to me - it's simultaneously complex, yet simple. Non-stop, everyday, it pumps blood to support life...I mean, take a moment to stop right now and remember that it is currently beating, and will create billions of more heartbeats throughout your lifetime. Amazing, right?
As computer scientist, I'm interested in the heart because it reminds me of the logic of a programming. It has variability and recovery, which are almost like parameters within a function that impact the end result. And of course, the logic of the heart can be understood through waves on a graph that explain the electrical impulses that allow the heart to beat and pump blood throughout the body.
This information is collected through an ECG, or an electrocardiogram, that uses electrodes placed on the skin to gather data about the electrical activity of the heart and graph the voltage over time. If you want to learn anything about this organ, ECGs are the way to one's heart (hah!). They can provide vital information about life threatening conditions like arrhythmias, coronary heart disease and heart attacks.
How does an ECG work?
Okay, I have to nerd out for a minute about how an ECG even works. The heart is composed of four chambers - two atria and two ventricles. Blood enters the heart through the atria, and then an electrical impulse is generated. This causes the atrium to contract and the impulse is transmitted to the atrial ventricular node (the arrow at the center of the heart in the diagram below), which makes the ventricle contract. The ventricle is an extremely strong muscle that generates the force to pump blood throughout your whole body. The ECG is basically a representation of the electrical activity of the heart (the arrows in the diagram below represent impulses, not blood).
The wave you see on an ECG is composed of multiple peaks and valleys that reflect different conditions in the heart. The first concavity is the P wave, which tells us if the atrium contracts in a regular pattern. The second and more pronounced peak is called the QRS Complex. It represents the ventricular contraction. The last concavity is the T wave which represents the repolarization or the recovery of the heart after a heartbeat.
Many things can go wrong with each of these waves, so I'll leave at this: any slight irregularity, whether its a wide QRS complex, or an absent P wave, can mean cardiac problems.
Well, I'm not alone in my interest in ECGs and the heart...many electronics enthusiasts biohack and optimize their health, or use heart rate sensors to simply understand the organ. Manivannan is particularly interested in building an ECG that can "fit in a pocket and diagnose heart diseases independently without cloud connectivity," and thus support much of the rural world that may lack medical resources and general awareness about cardiac arrest symptoms. As you can see from my limited understanding of ECGs above, it's incredibly time and knowledge intensive to read an ECG, so having a device that could read and interpret the data, as well as be distributed anywhere, would be literally life-changing.
The Project
Since Manivannan wanted a portable ECG that could be used in rural areas, it was pertinent both to not have any dependency on the internet, and to have high accuracy in results. So, he trained a machine learning model to read ECG patterns and classify them into normal, atrial fibrillation and first-degree heart block using Edge Impulse. This is advantageous because the model is already trained and doesn't require internet access, and the latency is low.
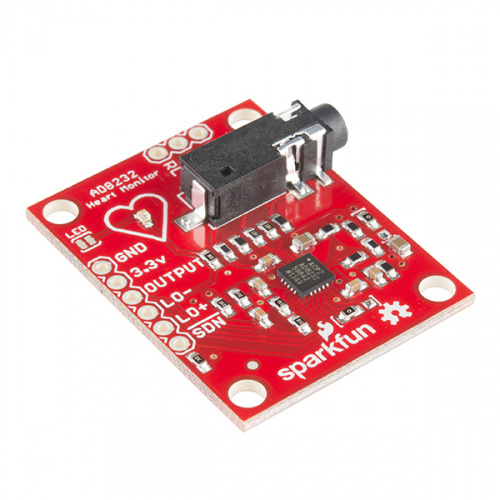
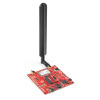
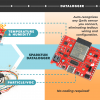
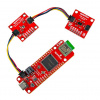
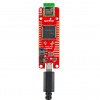
The project used SparkFun's Single Lead Heart Rate Monitor, which can extract biopotential signals created by electrode placements, even in noisy situations.
Manivannan's build out is a great example of a project that undergoes specific steps to build a robust end-product, instead of jumping ahead to build out the machine learning model right away. His process includes research on present day ECG analyzer machine features, building a basic version of an ECG analyzer, and then finally porting it over to Edge Impulse to train a model.
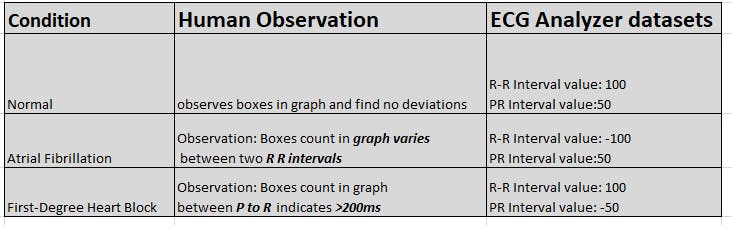
In training the model to classify conditions, using filtered ECG data alone resulted in a model with only 23 percent accuracy due to a short window. A longer window time heavily increased RAM usage and processing time. So, he ultimately coupled ECG data with human observations, which greatly increased the accuracy of the model.
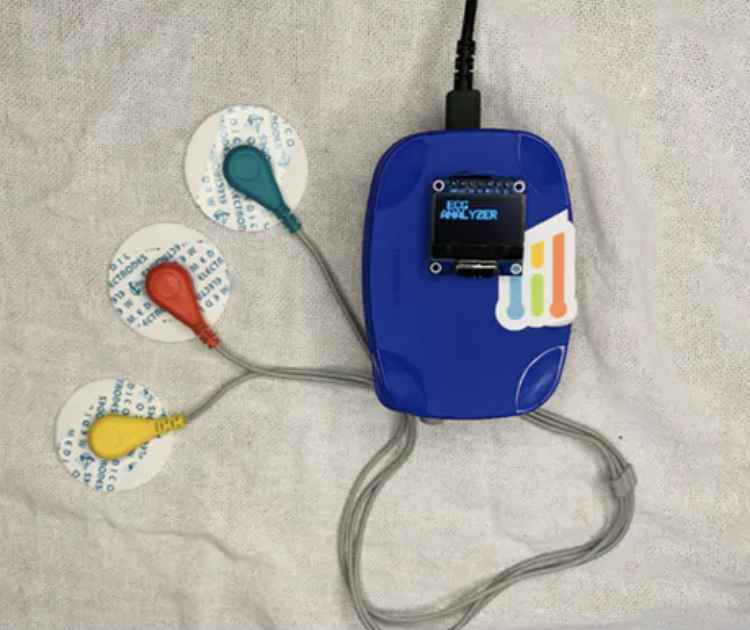
The final version of the device can classify and predict normal, atrial fibrillation and first-degree heart block with >90 percent accuracy! This is a very smart and effective showcase of providing equal medical access to those in rural areas who lack devices and education. Make sure to check out Mivannan's other projects on ArduinoHub - he has built other health-centric and Edge Impluse projects that could inspire your next project. Who knows, maybe what you build next in your garage could help the lives of others! That's really how all medical machines started - as prototypes that were iterated upon and tested until they disrupted how we understand bodies forever more!

