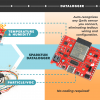
We've shown you before how to send sensor data over WiFi, but this time we're taking it a step further. Our newest tutorial shows you how to use this WiFi data connection to then visualize your data in real time on an IoT Dashboard.

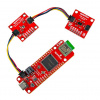
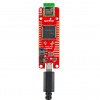
Rob and Mariah use a Qwiic-enabled air quality sensor with this project, but you could use any sensor in this type of project - your data visualization possibilities are endless!
Take a look and see how you can update your latest sensor project to include WiFi and a data visualization dashboard, and let us know how it goes by tagging us on social, we can't wait to see what you create!

