BASE Jumping with Accelerometers
A great project from a mad customer and new products in RFID, GPS, and a new WiFi module!


Well, that's one way to get back down the mountain.
Michael Cooper sent us these amazing photos and data plots:
"I thought you guys might get a kick out of this. I wrote my own firmware for the WiTilt, which gives 250 Hz of accelerometer data with 16x oversampling. The data is sent via Bluetooth? connection to my Palm Tungsten, which takes care of logging."
"I thought you guys might get a kick out of this. I wrote my own firmware for the WiTilt, which gives 250 Hz of accelerometer data with 16x oversampling. The data is sent via Bluetooth? connection to my Palm Tungsten, which takes care of logging."

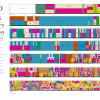
Jump Plot
"A couple of weeks ago, I took it for a BASE jump from my favourite
1200-foot cliff. I?ve attached data from the freefall portion of the
jump and the first few seconds of canopy flight. The grid is 1 second
on the x-axis, and 1 G on the y-axis. The black line shows total
acceleration, while the coloured lines show each axis (after
calibration). In the 'jump' plot, you can see clearly where I jump, at
the 1 second mark, and where the canopy opens, at the 9.75 second mark,
after 8.75 seconds of freefall. You can also see the point, at about 3
seconds, where wind resistance becomes significant, after which I
appear to be resting on my belly on a cushion of air."

Whooooooooooaaaaaa! That's awesome!

Canopy Plot
"Opening shocks, visibly mostly in the 'canopy' plot, are a bit of a jumble of actual opening shock (which is quite a blow), and oscillations which show me being kicked out under the open parachute... I've often compared the opening of a BASE parachute to a car wreck. Of
course, we like our parachutes to open fast, but I will often feel symptoms
of whiplash after a weekend of jumping. "
Thank you so much Michael! Those pictures send chills down my spine. Keep jumping, and stay safe!
Now for slightly less adrenaline pumping photos - new products!

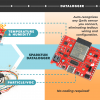
New USB eval board for our RFID readers. This simple board allows you to plug in the RFID module of your choice. Bring a card near the reader and you'll get a serial stream containing the unique ID of the card. Nice and simple. We've also posted the Eagle files to help out the SparkFun interweb of users.

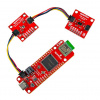
GS406 is a powerful GPS receiver with a Sarantel Helical Antenna and a uBlox 4HZ engine. Now you can get solid GPS coordinates 4 times a second!

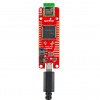
We brought back our WiFi category just for this new module. The WiFly is right up our alley: It's a simple to use, small, low-cost module, and this time it's for WiFi wireless. Now you can connect your embedded project over 802.11b with just a serial connection.

We've updated the pictures for our Button Pad breakout. We've also posted the Eagle files for this board!

Yay! The way KinetaMap was supposed to look - now with a label!


About 120 mph. It takes about 12 seconds to get there, but by 9 seconds, you're already going more than 110 mph. You can see the z acceleration levels out significantly at about 7 seconds on the plot, after which the plot looks pretty much like someone lying on their stomach (with a lot of wind noise).
great post!
this jump is amazing! truly insightful how this technology and rfid readers and passive rfid readers can work side-by-side with some serious excitment!
Sweet! I shared this link on Twitter.
@jesseluna
The jump is in the Canadian Rockies.
where was that picture taken?
Very nice :) What is terminal velocity in your human configuration?
whooaaaahhh!!! hahaha