Enginursday: Fun with Sockets

These Raspberry Pi tips and Python tricks let you take your sensing projects off the desk and into the wild with wireless transmission and processing of data.
Does Moose, my beast of a chocolate lab, roll around in the throes of boredom when I'm not around? Or does he just sleep? I wanted to see an account of the shenanigans afoot in my home---or lack thereof---on the days Moose doesn't make it to work with me. I wanted to be able to graphically track Moose's activities using a low-level network interface by sending data from the Raspberry Pi to my workstation through both a server and client socket, respectively.

First the data needed to be serialized for transmission. In this case, I'm using Google's Protobuf, a protocol buffer that is an automated solution to serializing the data. It encodes and parses the data on one end and reads and decodes it back to its original form on the client side. A socket makes communication between the Raspberry Pi and my computer easy, fast and convenient. I can now unload data straight to my computer for processing without storing any of it on the Raspberry Pi itself. And with a few calls to matplotlib in the script the data is automatically graphed very similarly to MATLAB. All the sensing is done on Raspberry Pi, with all the data processing done on my home computer. The data processing takes seconds on my computer, where it would have taken much longer with less data on the Pi. Before leaving for work I run the program on the Raspberry Pi, and when I get home I "ctrl c" to stop, which also starts the graphing. Then I can look to see what Moose has been up to.
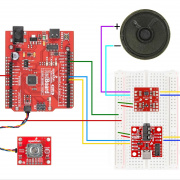
Ryan "Mort" Mortenson, a SparkFun customer and "nerd from the wild," volunteered to create an I2C library for the SparkFun 6 Degrees of Freedom IMU Digital Combo to use with Raspberry Pi and Arduino-compatible products. Since I'm currently enrolled in a Python course, I figured I'd take on the challenge of testing his work-in-progress on the Raspberry Pi. The following project uses a Raspberry Pi 3, the SparkFun 6DoF IMU Digital Combo, an Intocircuit Power Castle and a Windows 7 machine with Python 2.7. If you don't know what version of Python you are running on either your workstation or Raspberry Pi, then run the pi_requirements in the project files link below, and all required packages will automatically be installed. You will need to download this twice---once on the server, the Raspberry Pi, and once on the client, your personal workstation.
If you are new to Raspberry Pi, I recommend starting with the Getting Started Guide for Raspberry Pi and connecting to your Pi through an SSH connection. On both machines, make sure Python is in your path. Windows users may have to edit their environment variables to use pip to install. If you are using pip, the command is: "pip install -r pi_requirements".
Getting Started
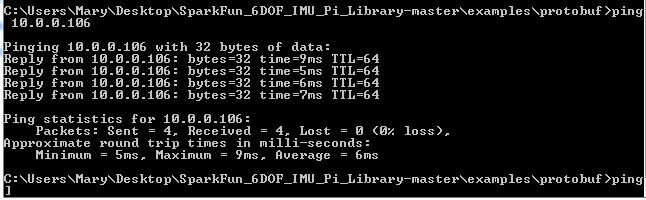
SSH into your Raspberry Pi and have it powered portably. I needed to get a range on how far Moose could get away from the router before the socket failed, since it is over the same network. To do this, I moved the Raspberry Pi around my house and pinged its IP address until it failed. I found out I have pretty good coverage throughout my house and backyard as well.
Open a terminal window and type the command: "ping IP address". You'll need to know your Raspberry Pi's IP address. (Knowing your Pi's IP address is also necessary for using another machine to SSH or VNC into your Pi, so you should already have it.)
Hardware
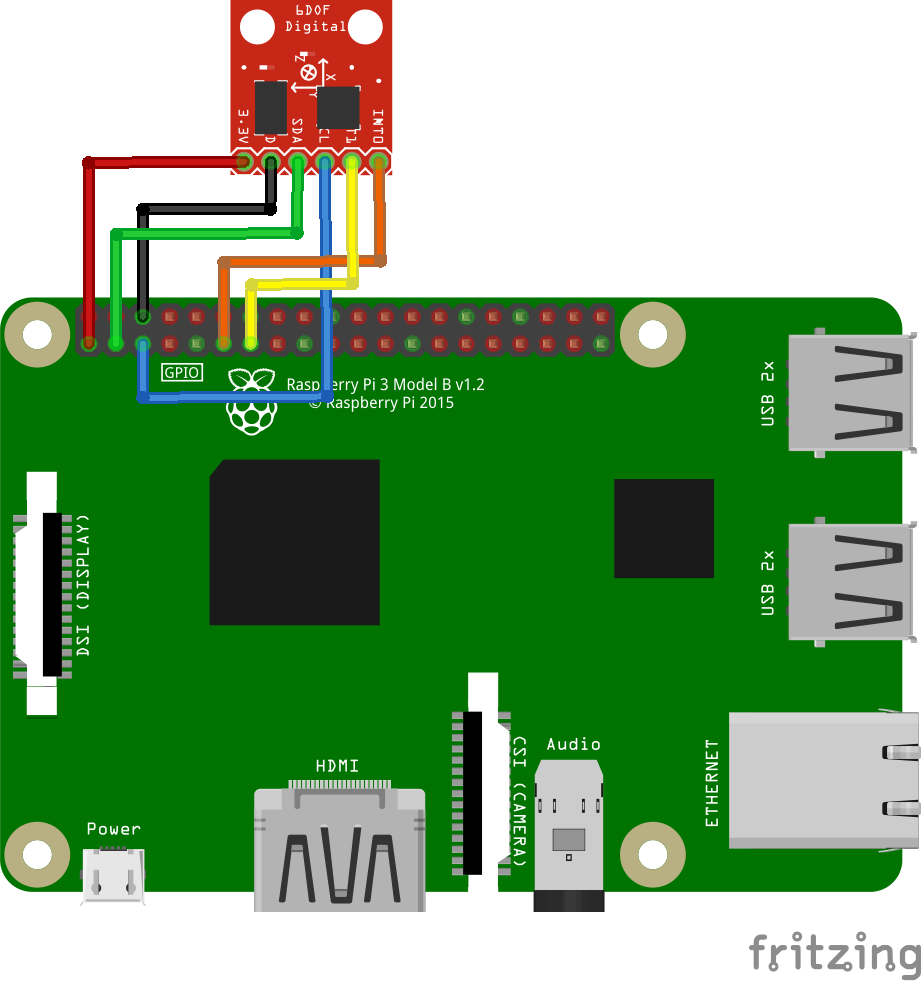
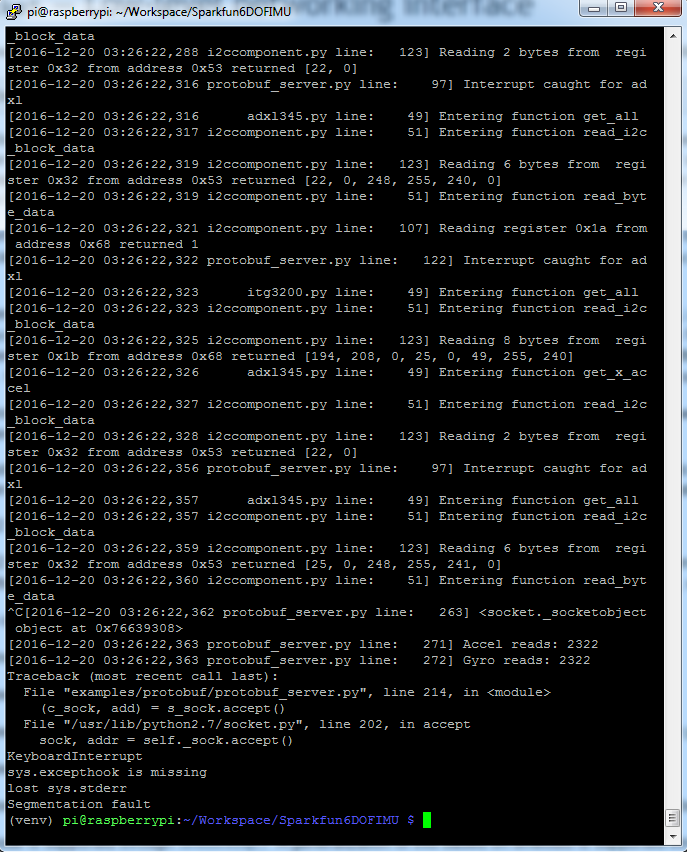
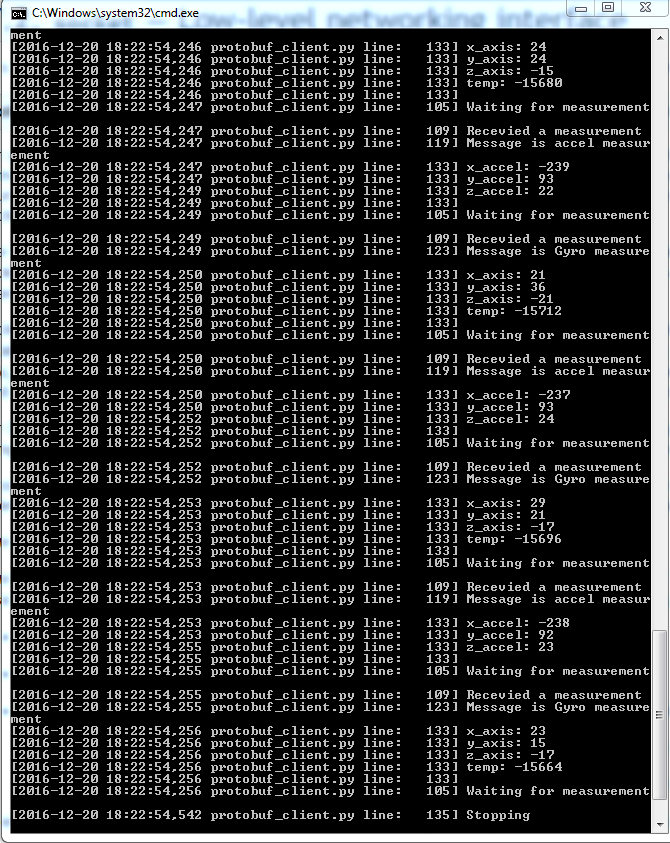
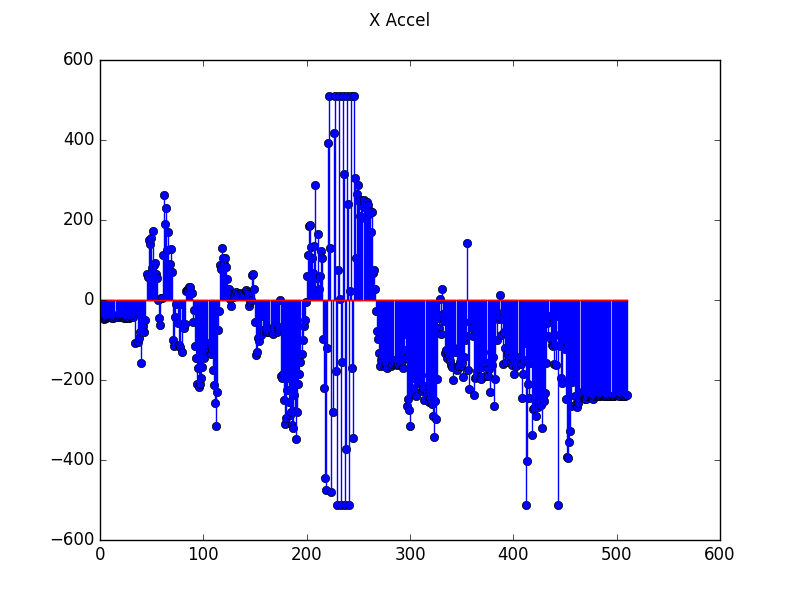
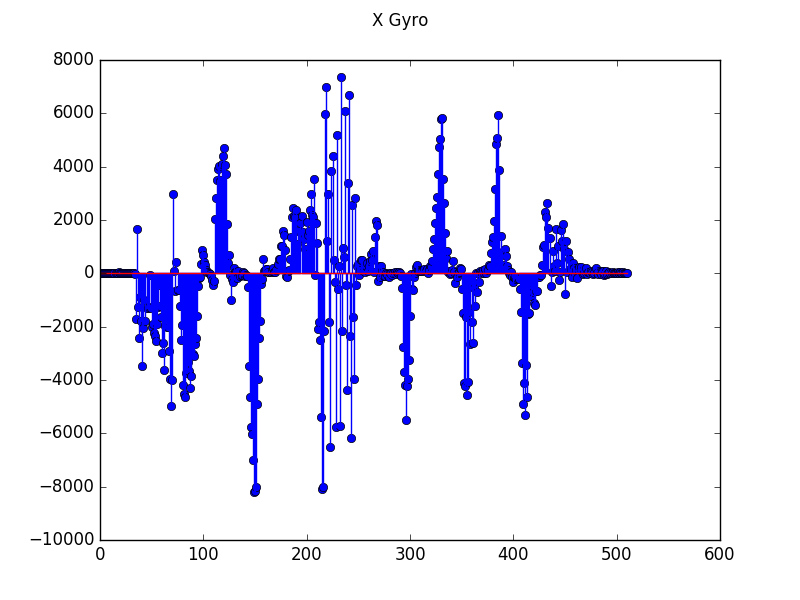
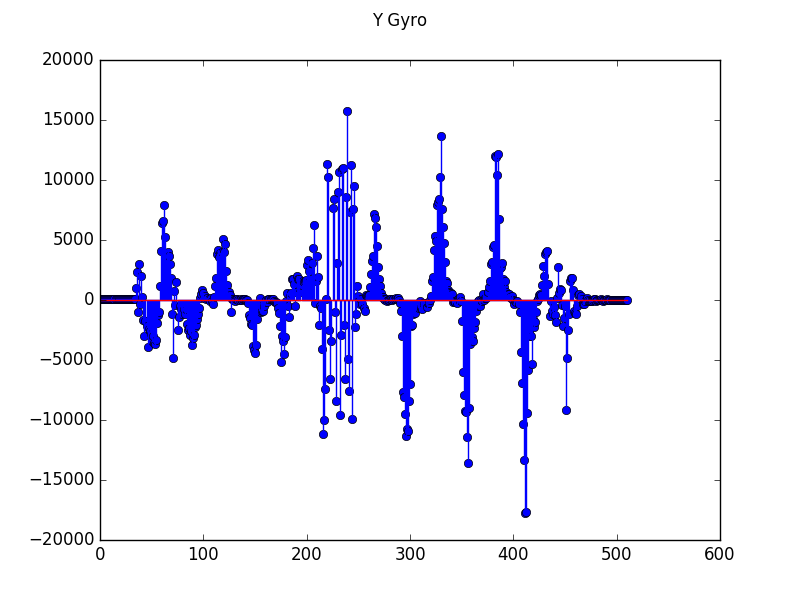
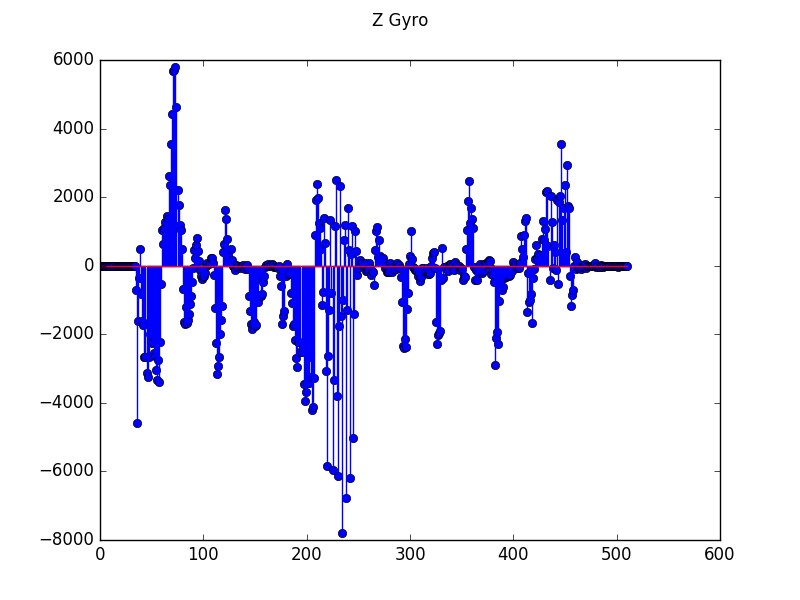
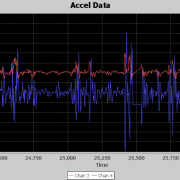
Now I have this 6DoF board attached to the Raspberry Pi's GPIO, and it's powered through a portable power bank and all tucked in to a doggie backpack. With Mort's protobuf_cleint.py running on my home workstation and protobuf_server.py running on the Raspberry Pi, the data is read from the 6DoF IMU, serialized to a string and sent over the socket network interface. Killing the program pulls up the graphs of the X, Y and Z data for both the Accelerometer and Gyroscope readings. Here is what it looks like:
Once the socket communication is severed, the graphing begins. This is a graphical representation of the raw data; it hasn't been converted into any meaningful or useful data yet.


From here, a more playful project may be to characterize the flight of a homemade RC plane with a Pi Zero and smaller battery pack instead. Look for a new project in the tutorial and 6DoF IMU Combo Hookup Guide coming out soon.
In the meantime, Moose will keep his jet pack on for further testing while I figure out the data conversion in matplotlib.

