Blynk Board Project Guide
 jimblom
Project 9: Graphing Voltage
Electrical engineers love measuring voltage. Whether we're using a multimeter to get a real-time view into a line's potential, or a monitoring a periodic signal's shape using an oscilloscope, monitoring voltage can be critical to project-debugging.
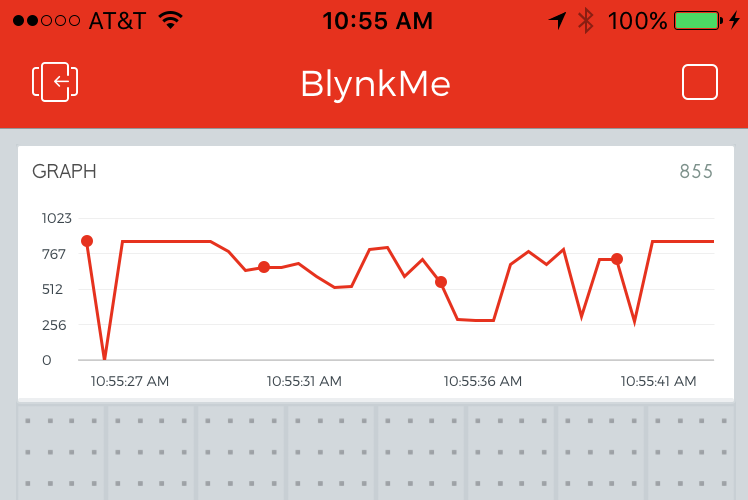
While we can't really re-create an oscilloscope's signal-triggering in Blynk, we can chart the Blynk Board's voltage-over-time using the Graph widget. The graph widget periodically pulls in data from a virtual or physical pin and creates either a bar or line graph representing how that input changes over time. You can set the graph to draw as fast as four times per second, or as slow as once-a-minute.
Hardware Setup
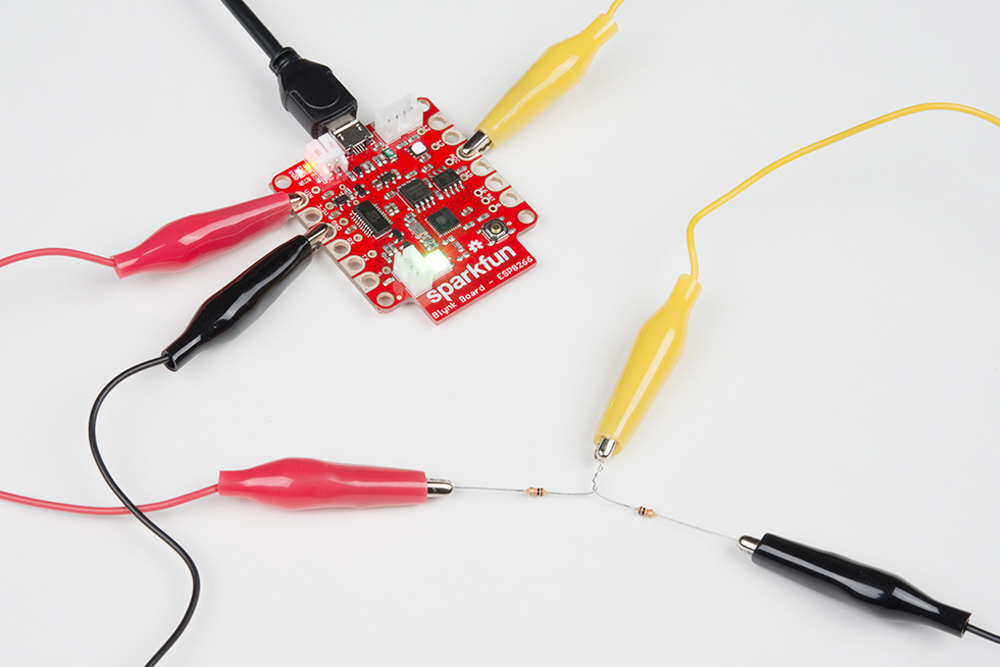
The Blynk Board's input voltage will range anywhere from 3.7 to 6V -- well outside the acceptable input range of 0-3.3V. So, to properly measure the input voltage, we'll need to step it down using a voltage divider. Although it sounds complex, a voltage divider is actually just a pair of resistors sitting in between one voltage and another.
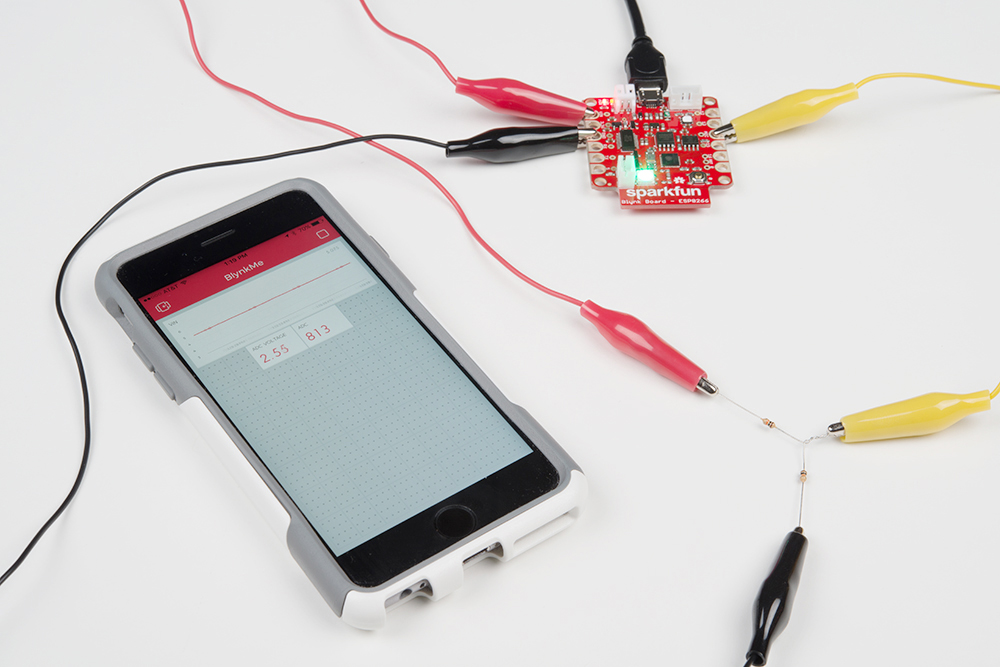
To create a voltage divider, first grab a couple 10kΩ resistors, and twist them together at the ends. Clip a yellow alligator clip to the twisted legs of the resistors, and connect red and black alligator cables to either of the other two legs.
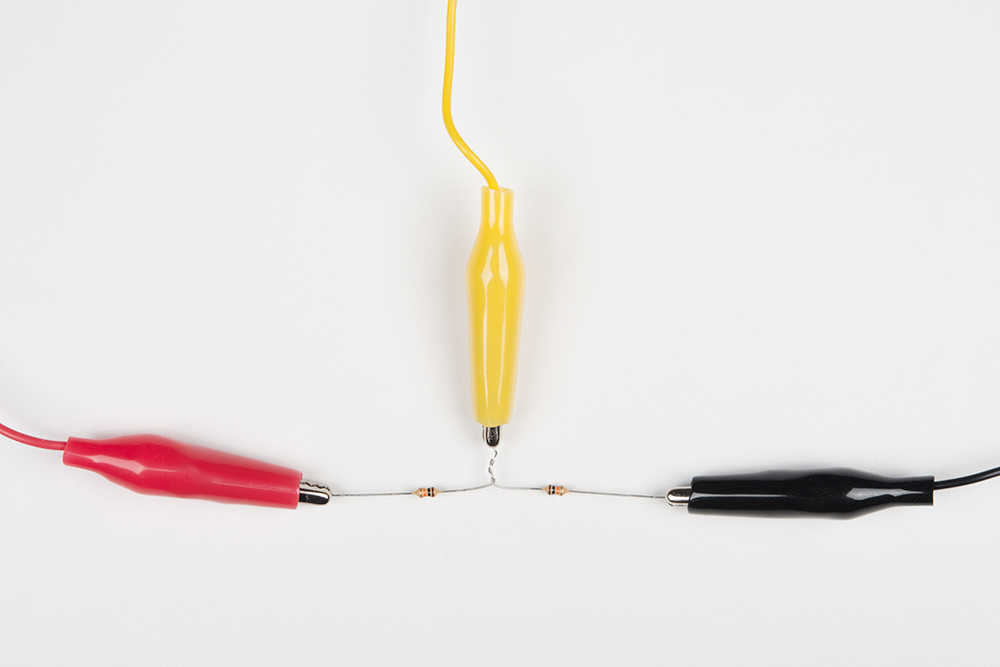
Wire the other ends of the cables to ADC (yellow), VIN (red), and GND (black).
Voltage: divided. A voltage divider made out of two 10kΩ resistors will cut the voltage in half. So, if the Blynk Board's input voltage is 5V, the voltage at the ADC pin will only be 2.5V.
Blynk Setup
In addition to the graph widget, you can optionally add two value widget's to help get a better view into the Blynk Board's voltage measuring.
Connect the Graph to V20
You'll find the Graph widget under the "Displays" section of the widget box. Add it, then tap it to configure. Set the pin to V20, and adjust the range to something like 0-6.
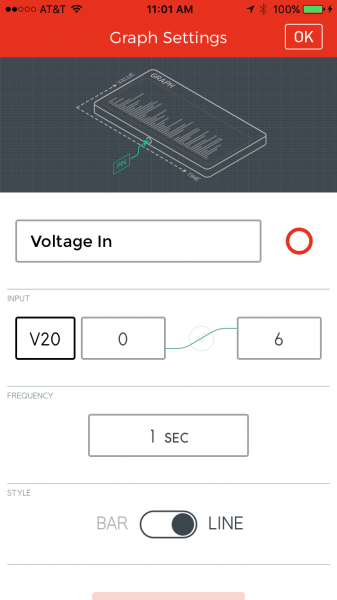
You can play with the Bar/Line switch, but a line graph seems to work best for this type of data.
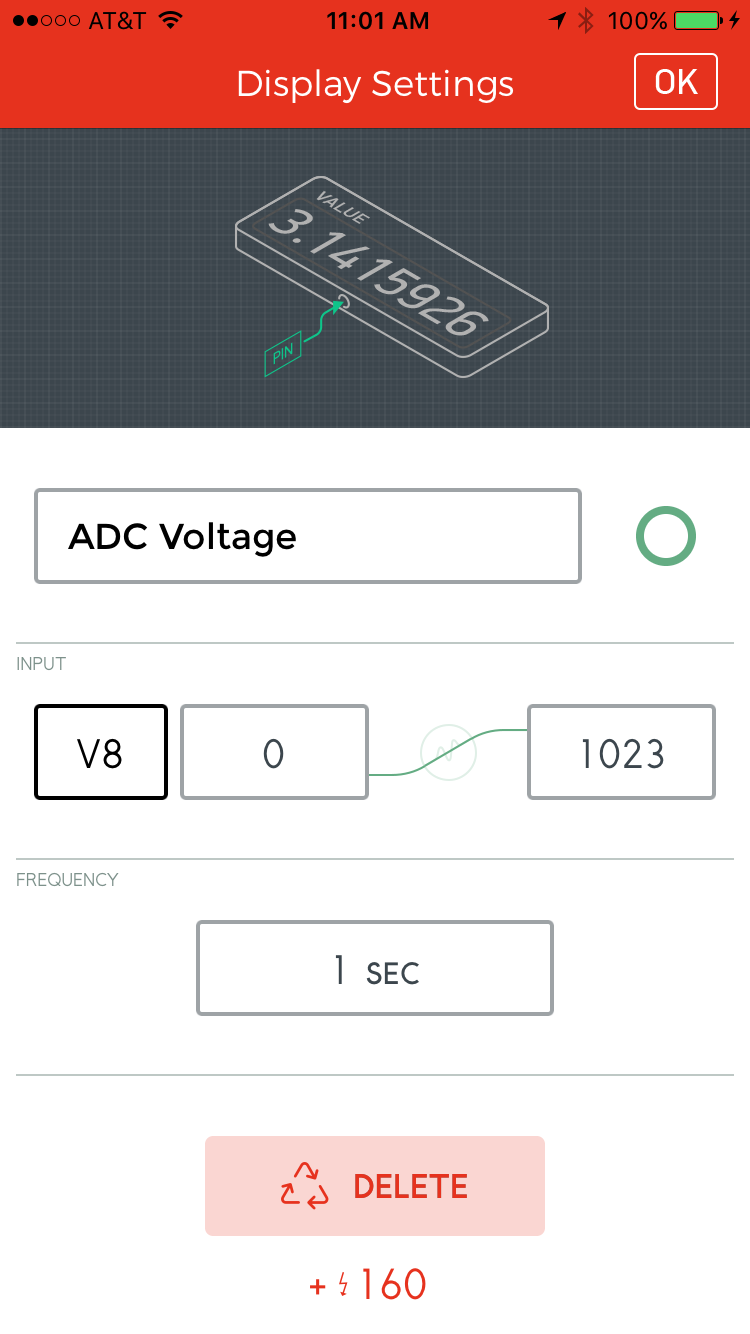
Monitor the ADC and V8 With Value's
For a bit more insight into the Blynk Board's ADC reading, consider adding a couple value widgets to monitor the ADC pin and V8 -- the calculated ADC voltage.

Blynk Run
See how steady that USB supply is. Try zooming the graph in, so the minimum is 4 and maximum is 6. The more "wiggles" in the signal, the noisier your supply is.
Fortunately, the Blynk Board regulates that input voltage, to create a nice, steady 3.3V supply. In fact, if you want to measure the 3.3V supply, simply swap the red cable from VIN to 3.3V. Is it steadier than the VIN supply?
Plotting Battery Voltage
If you want to recreate that feeling as you watch your phone’s battery-life icon progressively empty – or the excitement of watching it charge, consider powering the Blynk Board with a LiPo Battery. There are a variety of Blynk Board-compatible LiPo batteries, we recommend either the 400mAh, 850mAh, or 1000mAh.
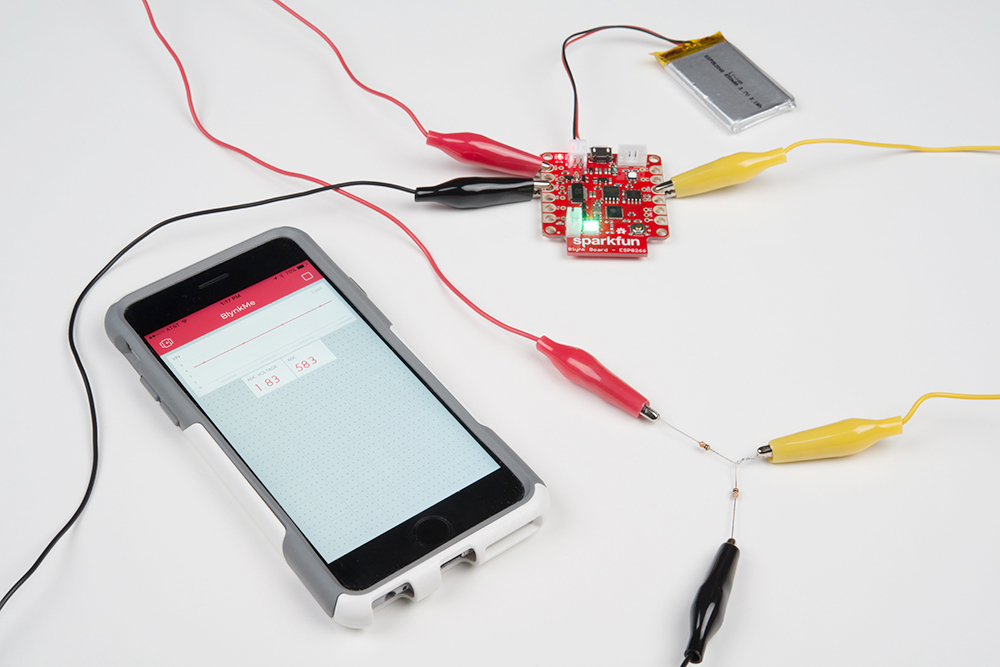
If you set the read rate to the maximum – 59 seconds – and let the Board run for a while, you should begin to see an interesting downward slope while the battery discharges. Or plug in the Blynk Board, and watch that slope incline.
Going Further
The graph widget should work for any of the Blynk Board's output values. Try changing it to V5 or V6 -- see how the temperature fluctuates over time. You may need to adjust the graph's range to actually see the line.
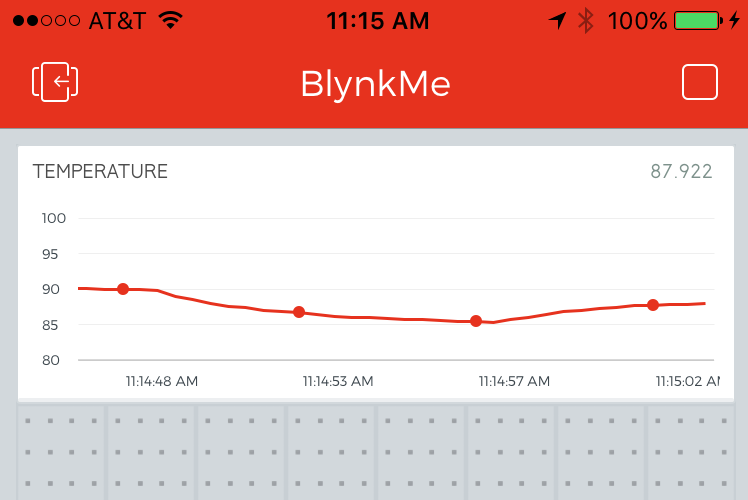
Try plugging other Blynk Board outputs you've already used into the Graph widget. Make some interesting curves!