
Bubble Logger
Counting Bubbles
I've been making wine with my family ever since I can remember. It's a fairly straight forward process that is nearly impossible to master. The wine my family made always started a grape varietal (such as Merlot
or Sangiovese). We would crush the grapes and throw the slurry into
primary fermentors where we would add a specially cultured wine yeast.
After a few days of this harsh smelling fermentation, we would then press
the grapes and put the liquid into glass carboys where you would then
add chemicals, sugar, and put the liquid under a water lock to keep
natural-air yeasts from infecting the brew and turning it to vinegar.
This goes on and on for months, until you might end up with something
that tastes pretty good.
Now let's say you're a poor college student. How to brew cheap wine? You can combine grapes (or cheap Welch's grape juice), some water, and some yeast (I even sunk so low at one point where I used bread yeast) and you will undoubtedly end up with something that resembles wine. It won't taste good! But it should get you snake-eyed. Either approach uses a very straight forward biological process of yeast, eating sugar, and giving off CO2 and alcohol. Wouldn't it be fun to see how this biological process acts over time?
I decided to return to my roots and whip up a batch of world (in)famous homemade wine. And while I was at it, why not log the bubbles that are given off during fermentation?

Step 1 was to get all the materials together. Grape juice, acid blend, yeast, sugar, hydrometer, journal, a fermentor with water lock, and a big spoon.


Mmmm! Grape juice goes in. What will come out?


Added:

I found the initial sugar level from the frozen juice was about 1.025. I wanted the level to be near 1.080. Time to add sugar!

- 4 cans Welch's Concord 100% Grape Juice
- Tap water to 3 gallons
- 2 tablespoons acid blend
- 1 spoon pectic powder
- Lalvin K1-V1116 wine yeast

I found the initial sugar level from the frozen juice was about 1.025. I wanted the level to be near 1.080. Time to add sugar!

1.040 - getting there!


After dumping nearly 5 lbs of sugar into the mix, I finally hit 1.085! 5lbs!

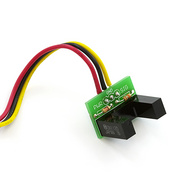
Now the point of this experiment is to capture the rate at which bubbles (we presume CO2) are vented off the fermentation. I found that this 'double bubble' air lock worked great with our IR photo gate:

Now the idea is to take the Logomatic and reprogram it to record when a bubble goes by.
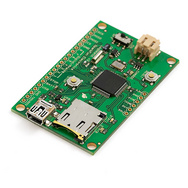
With a little testing, I was able to confirm that the photo gate would trigger each time a bubble went by. Then I spent a few days streamlining the Logomatic code to fit my purposes. The Logomatic is a fantastic little product. Ryan's USB bootloader makes it easy to reprogram the Logomatic with new firmware specific for my needs.
Here is a link to my cleaned up Logomatic code. It doesn't support the regular config file parsing that makes the stock Logomatic so great, but I think this code is easier to understand and should serve as a good starting point for people wanting to edit the firmware for their own purposes.
Ok - so the brew is brewing. The Logomatic with Bubble Logging firmware is installed and running. Now with the magic of TV, we can fast forward 10 days.
Stats:
- 3,118,000 bytes of logs
- 159,098 bubbles
- 851,580 seconds
- 14,193 minutes
- 9.85 days
As with any logging project, getting the data is easy, visualizing it is the hard part. One of the problems with the logs is how the events were saved. The logs looked something like this:
Bubble #, Seconds elapsed
44732, 6211
44733, 6232
44734, 6296
44735, 6315
This made it very difficult to graph in Excel (or Calc because we use Open Office). These spreadsheet programs expect time to be linear. In my logs, time jumped around as the bubbles rolled through. I also had 7 or 8 logs as each morning I would reset the system to make sure I didn't overflow any given text log file. So to stitch the logs together and fix the time-base problem, I created this quick and dirty Visual Basic program. I publish it so that hopefully you can use similar text file parsing tricks as the basis for your own log challenges.
Can someone show me how to write something similar in Python? I should really learn Python one of these days.
After stitching, I ended up with a nice linear time-based CSV file (check it out!) that can be easily imported into your favorite graphing program. In this case, I used the very limited Excel to graph the bubbles per minute over a 10 day period:

I am so bad with Excel, I can't even get the axis labeled correctly. On the left axis we have bubbles per minute. On the bottom axis we have seconds elapsed. Wouldn't it be nice if that axis was in hours or days? Man I hate excel. Can someone take this excel file and show me how to get the axis in days?
Graph submitted by JWood (user comments):

What can we learn from this graph? Assuming the data is sort of correct, it fits with what I would expect: the fermentation heats up quickly and (logarithmically?) dies as the yeast consumes all the sugar.
There is some interesting behavior on the tail. There are rhythmic dips in bubble production. This could be an interesting yeast behavior, or it correlates with each morning that I got up and reset the system (tapping the bucket and disturbing the system).
Perhaps those dips are around when I would come home and the vibrations of walking around caused latent pressure to be given off? No, that doesn't really make sense with the data. But I did notice that my walking around was enough to cause the air lock to shake out a bubble.
In the end, the system seems to work. But I did notice that the photo gate did not catch every bubble. A bubble could slip by undetected. The system was also unable to capture multiple bubbles within the same second (possible during peak fermentation). I believe I captured the rough nature of the fermentation process but it certainly could be run again.
Oh, and the wine? It was murky, smelly, horrible concoction that got sacrificed down the sink.
Questions to answer:
What is the best way to visualize data stored in text files? Phython scripts? There must be something online?
How to beat excel into shape?
Graph submitted by JWood (user comments):

Ahh! Much easier to read. Thanks JWood!
There is some interesting behavior on the tail. There are rhythmic dips in bubble production. This could be an interesting yeast behavior, or it correlates with each morning that I got up and reset the system (tapping the bucket and disturbing the system).
Perhaps those dips are around when I would come home and the vibrations of walking around caused latent pressure to be given off? No, that doesn't really make sense with the data. But I did notice that my walking around was enough to cause the air lock to shake out a bubble.
In the end, the system seems to work. But I did notice that the photo gate did not catch every bubble. A bubble could slip by undetected. The system was also unable to capture multiple bubbles within the same second (possible during peak fermentation). I believe I captured the rough nature of the fermentation process but it certainly could be run again.
Oh, and the wine? It was murky, smelly, horrible concoction that got sacrificed down the sink.
Questions to answer:
What is the best way to visualize data stored in text files? Phython scripts? There must be something online?
How to beat excel into shape?
Nate
I see that you are not detecting some bubbles AND that you need to block ambient light somewhat.
Why not put a couple drops of food coloring into the water trap. Say dark blue? This way the transmitivity will be very different between a bubble and no bubble. Bet this also makes blocking the ambient light unnecessary.
If color will help readings, a drop of iodine (a common wine sanitizer) will do it..
Nate,
What if you wanted to be VERY accurate in count and groupings? How would you modify the current configuration to account for exact measurements?
Great piece and thanks for the article!
Not sure. I would have to find some chemistry friends and find out how they detect gas volume accurately. I'm thinking a closed system with a pressure gauge would work but I'm not sure how built up pressure would hinder the growth of the microbes/yeast/etc.
Two words: pivot table. You have a serious dilemma on your hands; a choice between vice (alcohol) and virtue (saving energy). Here is the plot of bubble activity by hour and day.
http://www.circuitpeople.com/Blog/Attachments/Wine.png
Looks like the nights (cool temperatures?) are hard on those little bacteria.
:)
Yep. They could smooth the temps some by placing the Wine bucket inside a water bath, and draping the sides with a wicking towel.
5 pounds of sugar? Must taste like hot jet fuel. 50%+ of fermentables being sugar is too harsh. I've made acceptable Welches wine.. Just add more concentrate until you get the desired original gravity. Get concentrate which is pure.. No sugar or corn syrup.
A pity The logger device featured is no longer available. This tutorial could probably be updated for Arduinos now..
PS - not bacteria.. Yeast are fungi kingdom. :)
If you really want some cool Open Source computing power for managing, displaying and analyzing data check out program R. It will do anything you want to do and most everything is already coded at lower levels for you including basic statistical packages, Kalman filters, calls for other programs (WinBUGS (for Bayesian analysis), ArcGIS (spatial and gps data)), whatever....http://www.r-project.org/ Of course it has a learning curve, but R is a pretty easy language to learn/use. Excel is awful for data analysis, if you are even slightly serious about the analysis stay far, far away.
If you want to get serious about plotting I highly recommend matplotlib.
It is python and super easy to create great looking results. Find the kind of graph you want on matplotlib gallery and crib away.
You should add temperature logging too since that is such a key variable in the proper fermentation of wine.
Yes temperature is probably what makes "interesting behavior on the tail", which looks like the nightly temperature drop.
You could easily stabilize temperature. I used once a cheap aquarium heater (with integrated thermostat) to accelerate sourdough fermentation in a bread making process. The idea is to put all the installation in a bucket of temperature controlled water.
Hmm, nice explanation. I'll have to capture the time base more accurately on the next experiment. I need to know the time that the bubble happened, not just the rate.
Graph as jpg
OpenOffice spreadsheet file
I just added a "Day"=minutes/(24*60) column and did an XY(scatter) graph with days on the x axis and bubbles per minute on the y axis.
I don't have excel at home, but I have crunched numbers like this at work. The easiest way I have found is to create a histogram (http://www.vertex42.com/ExcelArticles/mc/Histogram.html)
That's what I was looking for! Thanks for the example.
Yeah, theoretically that graph should be a log scale. My bio teacher just spent roughly half my life explaining that. As the mass of bacteria:waste:food ratio changes (mass inc., waste inc., food dec.,) And then the level hits a tipping point where the food is gone and the waste is too high. Remind anyone of a certain planet?
It is an exponential decay (often seen in natural systems) that should appear (approximately) linear on a log scale.
e.g.
ln e^{-ax} = -ax
Thanks for a super cool 6 year old tutorial :D
I am trying the same thing... But with a Raspberry Pi and a IR Beam Break (https://www.adafruit.com/products/2167). The module works fine, but it wont register a bubble passing by. I am using the same kind of air lock as you.
Got any advice on how to make the module register the bubbles in this case?
Thanks in advance!
How did it go for you, did you manage to count bubbles? //M
I use this for making graphs: I know it's for kids but it works http://nces.ed.gov/nceskids/createagraph/default.aspx
As someone who has been doing a good bit of fermentation lately, I can tell you that those bubble airlocks create an audible, distinctive sound for each bubble. Furthermore, the airlock shakes (vibrates) noticeably as bubbles pass through. I think it might be interesting to compare the accuracy of using either a sound or vibration sensor. The setup would be very similar to what you already have.
You might get a better bubble count if you put black food dye in the water in the airlock. Or something similar to make the water less transparent.
Also if perchance your fermenting outside or with windows open where bugs can enter - I find they get attracted to the CO2 or smell or something and end up dead inside the water in the airlock which defeats the purpose of a hygenic seal.. So try putting a wad of cotten ball over or in the outlet - J.I.C.
Damn, this sure beats the little one I was tinkering with using the analog in pins on the joystick port. Especially since most modern systems don't even have one. Did you only use it this once, or have you tried it on multiple brews?
Just once, but the process is fairly repeatable. I'm thinking of using an Arduino and an OpenLog next time. Would be a bit less daunting than editing the Logomatic firwmare directly.
That's awesome!
You can almost hear the yeast cells going "YEA!!...awwww..."
What battery did you use and how long did it last?
Also, gnuplot is really easy to use and makes some nice looking plots.
I used the basic 2000mAh LiPo. Should work for days but just to be sure I attached a 5V USB charger cable to the Logomatic.
As the other user said, learn gnuplot. It's pretty simple/quick to make plots with. Format the data as: "time bubble_count\n" and concatenate all your logs into one. Then from a gnuplot command line type 'plot "filename.log" with lines'. You can interactively zoom, get values, etc. You can also write the graph to a png if you want.
A couple of thoughts:
The data is fairly "choppy". Some minutes there are no bubbles, other times there are a lot of bubbles. There's a high deviation of bubble distribution when your sample period is a minute. Logging bubbles per hour cleans that up significantly as the by-hour chart shows.
Bubbles per time unit is an ok way of measuring progress but really, the better way is to measure the amount of CO2 generated. You can do this by measuring the volume of a bubble (or maybe a couple thousand...) and doing the math. But see my comment on "continuous bubbles".
A dark, sterile fluid in the airlock would increase the bubble contrast and allow you to decrease the sensitivity of the phototransistor, thus maybe reducing/removing the interference of ambient light.
In brewing beer, when the yeast really gets going, I will see multiple bubbles that merge into one continuous "bubble". So timing the length of the pulse from the photo interruptor might be useful to determine total volume of gas.
Great idea - I had been wondering for some time how best (or easiest) to capture the CO2 generation rate in my fermenters, and the idea for the IR photo gate is the missing link. Funny that eduprey mentioned XBee and temperature... that's pretty much the direction I've been contemplating (with a PICAXE micro)...
Nate -- Thanks for the article. I especially liked seeing all the responses re: how to plot data. Write up a simple blog and get great collaboration from the community!
And thanks for the memories. When I was a teenager I brewed cheap wine at home. Welch's grape juice, sugar, and plain old bread yeast. Put a balloon over the mouth of the gallon jug, rather than a water bubble airlock. No sterilization, no hydrometer, and no ARM processor (circa 1970). It actually wasn't bad, if you like Mogen David. The only real disaster was once when the balloon burst in the middle of the night. What a mess all over the kitchen!
What is the best way to visualize data stored in text files? Python scripts? There must be something online?
You really might want to look into R and/or Gnuplot.
Just ran a quick fit using Excel (because I'm too lazy to code something else up tonight, and because even "quick" meant that I was up till 2am), and your data does, in fact, fit a simple model. Modifying a predator-prey model (the Lotka-Voltera equation) to account for the fact that sugar doesn't usually reproduce, I get the following:
d[sugar]/dt = A[sugar][yeast]
d[yeast]/dt = B[sugar][yeast]+C*[yeast]
which fits your data quite well for A=-3.16E-4, B=8.05E-3, and C=-1.55E-4, with [sugar] and [yeast] both 1 initially. Oh, and one has to scale to go from [yeast] to the rate of gas production. :)
Would ya, could ya, post a zip of your data logger files so we can take a look at the original data to help you on your python quest?
One thing I would suggest is to let the OS (Windows in your case) do the file concatenation for you - then, once the data is globbed together, do your data transform on it to get it ready for "Excel".
So if you had LOG06.txt, LOG07.txt and LOG08.txt you could do something like (in a DOS prompt):
type LOG06.txt > out.txt
type LOG07.txt >> out.txt
type LOG08.txt >> out.txt
This will put LOG06.txt into a new file named out.txt (the single > means create a new file with the output of type). Then additional files can be appended to out.txt by using the >> (which appends rather than creates a new file). By getting a little creative you could glob your daily output into an out.txt and then glob your daily out.txt files together, etc., to create a "master" log file with all of the data in it. This would be a good place to use a DOS .bat / .cmd file. Its been a while since I played around with Windows but I could probably help you with that as well.
Yes, I would really like the text files.
Here is a little batch file that you can use to glob the data from a bunch of .txt files into a single out.txt that lives in the same subdirectory. This started out as a single 'for' command but as I remembered my DOS scripting days I kept adding to it ;)
By allowing the OS to take care of the file concatenation step your python (or VB) program becomes simpler - no need to rewrite what the OS already provides. Yeah the batch file below is a bit overkill but I tried to make it fairly general purpose (and had some fun doing so)!
An example usage for Nate would be (assuming the batch file lived in C:\Global\BubbleLogs):
C:\Global\BubbleLogs>doit.bat C:\Global\BubbleLogs\UpTo-11-11-08
@echo off
REM make sure that we got a command line parameter
if (%1) == () goto USAGE
REM navigate to user supplied directory and process files
pushd %1 > nul 2>&1
if errorlevel 1 goto BAD_DIR
del /F /Q out.log > nul 2>&1
del /F /Q out.txt > nul 2>&1
for /f %%a IN (".txt") do (type %%a >> out.log) > nul 2>&1
ren out.log out.txt > nul 2>&1
popd
echo SUCCESS! out.txt created in %1
goto DONE
REM echo missing paramater/usage error
:USAGE
echo usage: doit.bat [directory to process]
goto DONE
REM echo bad user supplied directory error
:BAD_DIR
echo %1 is not a valid directory
goto DONE
:DONE
@echo on
Another option for plotting data is Ploticus: http://ploticus.sourceforge.net/doc/welcome.html
I've used it to plot weather data. Bubbles per minute should be easy. Sometimes I reformat the raw data by running it through perl, then into ploticus.
http://jtw.programmer.googlepages.com/out-graphed.xls
I wrote a simple macro that aggregated you data into hours. Then made a slightly better looking graph.
Cheers,
Thanks! Much easier to read. Posted.
Cool idea though, I'm a homebrewer and this would be a cool way to measure yeast activity in some of my beers. Unfortunately I ferment in a dark area (I use glass fermenters and the hops compounds break down unpleasantly in UV or even visible light -- "skunking") so I'd need to use some kind of dim ambient light for the photo gate to pick up the change with the bubble. An LED, maybe.
If anyone reading this is interested in getting into brewing, the best place to start is: "How to Brew" http://www.howtobrew.com/intro.html -- it's about brewing beer at home, but most of the same techniques and equipment apply to wine.
E
Actually, I had to put a hand towel over the system to keep ambient light out. The IR photo gate works GREAT in the dark, but ambient light has enough background IR that the gate only worked so-so.
Aha, I misread the IR bit, (doh). Also @stephen, good idea on temp. A low-power micro with this gate, a thermistor, and some kind of RF transmitter (xbee?) == realtime brew monitor.
Did you sanitize everything? (water, sugar, and all the equipment that came in contact with your wine?)
If not, your wine most likely got wild yeast or bacterial infection from unsanitary equipment or from the sugar or even from tap water. Nasty microbes are everywhere and love to eat sugar-water. Only certain microbes actually make something that tastes good.
You could make some decent tasting wine this way (see http://www.homebrewtalk.com/f79/welchs-grape-juice-wine-21093) if you sanitized your equipment. Immersion in solution of water and iodophor or star san [mostly phosphoric acid] or even bleach would do it. Also you'd want to boil at least the sugar (in a sugar-water solution) and the water. 15 minutes should do it. (for the water, you can just use sterile water like store-bought spring water, but the sugar needs to be dissolved and boiled)
Of course, if the point was just fermenting something to bubble for the experiment that you didn't intend to drink, mission accomplished. :) Of course, you could have just used sugar-water and bread yeast for that.