
Earthquake Data Logger
Not every project you create is destined for greatness. Or success. Or even completion. Sometimes you watch your lovingly crafted project fly away never to be seen again. Sometimes your project might be a "success" but provide an underwhelming result. This is the story of such a project.
Christchurch, New Zealand - where I live - had a 7.1 magnitude earthquake in early September this year. (And, no, none of my projects caused the earthquake.) While some areas had significant property damage there was no loss of life directly attributed to the earthquake. After an earthquake of this magnitude, smaller - but still noticeable - aftershocks can continue for weeks or months. As of mid-November there had been over 3000 aftershocks.

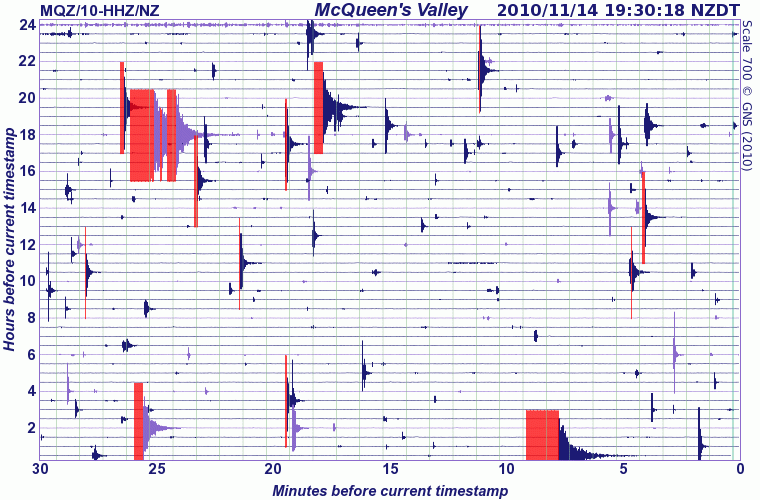
Following the main earthquake and aftershocks, GeoNet became a popular destination to find out the magnitude of events and view the images generated from the Seismograph Drums. This is one of the images generated from data recorded from one seismograph drum during the magnitude 4.7 and 4.9 earthquakes I describe later in this post:
One day I started pondering whether it would be possible to use an accelerometer to detect some of the aftershocks when they occurred. I had read about the Quake-Catcher Network project which distributes USB connected accelerometers for detection and research. But, hey, we like to make things ourselves here, don't we?
Unfortunately when the idea first occurred to me I didn't have any accelerometers and by the time I organized delivery most of those three thousand aftershocks had been and gone. This was probably the first sign the project was not to have a huge impact on the world of scientific discovery.
Choosing the Hardware
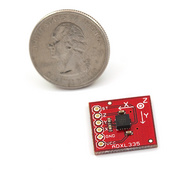
When deciding on the accelerometer to use I had the choice of an ADXL335 or an ADXL345. I decided to start with the ADXL335 because it's an analog device which means it's easier to hook up and get started with. (The ADXL345 uses SPI or I2C digital signals to communicate and because it's a 3.3V device I'd need to use some form of level conversion to hook it up.) While the ADXL335 can also be powered with 3.3V we only receive information from it so we do not need level conversion. We do, however, need to take this lower maximum voltage into account when interpreting the values received. (You may well think I'm making specific note of this because I forgot to take this into account until I started writing this post, but I couldn't possibly comment.)
An Arduino was my choice of microcontroller platform and it has more than enough analog to digital (ADC) inputs to handle the three axis accelerometer. It also has a 3.3V supply that can supply the small amount of current needed by the ADXL335.
It's always nice when someone has done the work of figuring out how to connect a device and in this case the Wiring project had a page demonstrating how to connect the ADXL335 to a board similar to an Arduino.
Writing the Software
Even better is when you've found someone has written the code you need to both retrieve the data from the device you're using and display the data in a useful manner. In this case the blog post Realtime Graphing of Accelerometer/Gyroscope Data helpfully had code for the Arduino to read the accelerometers and code for Processing to display the readings in real-time on a pretty graph.
I tried out the code and got some nice graphs when I moved the accelerometer around or placed it on a desk and thumped the desktop. Things were going well.
While displaying real-time graphs is nice if you're wanting to look at data immediately, for earthquake detection I was wanting something different. Most of the time the data you're receiving is uninteresting - all it's doing is indicating "no earthquake happening now". This means we want some way to store the data so we can go back and extract just the interesting parts from when an aftershock occurs.
My original plan was to use the WiFly shield to send the accelerometer data to some place "in the cloud" because apparently that's where all the cool kids are sending it these days. (Although the cloud does have its downsides.) Pachube is one web site that specializes in logging data from devices on the "Internet of Things". While I was looking at possible data logger options I also discovered Nimbits which apparently also enables you to run your own instance of their data logger application.
It was at this point I realized I may have a problem. The accelerometer was going to be producing tens of readings per second but - as far as I could tell - none of the cloud-based data loggers supported receiving data at this rate. I considered batching the readings and uploading them once every few minutes but again - as far as I can tell - none of the services support batch upload either. And, even if they did, I would have to deal with the situation of working out how to upload the previous data while still logging the new incoming data.
With reluctance, I decided to take a new approach, as I noted in my project log:
Given the low-ish likelihood of detecting an aftershock and the low likelihood of the building holding the Arduino falling to the ground, in the short term it probably makes sense to just record the data to SD card and retrieve it manually. This is less exciting but will result in something quicker. While there's a definite value in having direct to the web uploading the effort to create the infrastructure to support it is probably not really justifiable at the moment.
The MicroSD shield provided an easy way to record the data as I had already written a simplified wrapper library for the great sdfatlib library for another project. A slightly modified version of this wrapper library will soon be available as the SD library in the next Arduino release. After modifying a few lines of the original code it was now writing the accelerometer readings to a MicroSD card.
Collecting the Data
For power I decided to use a standard nine volt wall wart power supply. If I was really worried about the power going out during a quake I could have looked at some form of battery backup but under the KISS rule I left that for another day.
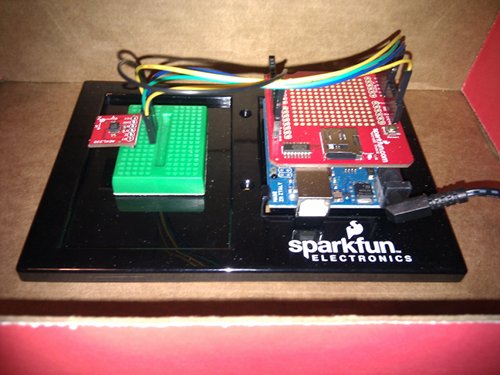
Here's the complete system wired up in its fancy enclosure:
I wasn't entirely sure where the best place would be to locate the device - originally I just had it sitting on the carpet under my desk but the results from there didn't seem to be very useful. I ended up sitting it on a window sill and just had to hope it didn't get knocked around by other people in the office.
Since I wasn't using the WiFly module I didn't have an easy way to get the current time for each data point I logged. A GPS might have been able to get enough of a lock for a time signal but initially I still wasn't sure how well the device would work. Once again I took the KISS option and just recorded the number of milliseconds since the last reset. (If I was more organized I would have noted the start time somewhere so I could calculate points after that—but apparently I wasn't.)
Once I had everything connected up I left it running until the earth decided to next move. From memory by this stage aftershocks had dropped from many a day to one or two a week.
Eventually a noticeable aftershock occurred and when I was next in the office I took a look at the data. There really wasn't much to see. Even when there was no earthquake the sensors would swing between a couple of values and there were no significant outliers. This was when I decided to try out the window sill as a better option.
Around a week later, early one Sunday morning there was an aftershock followed by another later in the day - around 4.7 and 4.9 in magnitude. I happened to be sitting outside in an armchair at the time and the shocks were noticeable for a number of seconds. (And, yes, I did check it wasn't someone rocking the armchair.) The GeoNet image near the beginning of the post shows how one of their seismographs recorded these particular aftershocks.
Processing the Data
It turns out recording around twenty samples per second generates rather a lot of data. In fact, about five million rows in the log files for around a week's worth of data. Given that your average spreadsheet tops out at a few tens of thousands of rows I needed to find a different way of processing the data. I tried out a few different software packages but didn't have much success.
I ended up using a combination of command line tools (cut, sort and uniq) and Python to produce an initial summary:
| X-axis | |||||||||||||
|---|---|---|---|---|---|---|---|---|---|---|---|---|---|
| ADC Value | 323 | 324 | 325 | 326 | 327 | 328 | 329 | ||||||
| Occurrences | 1 | 1 | 4,024 | 3,065,147 | 1,958,420 | 20 | 4 | ||||||
| Y-axis | |||||||||||||
|---|---|---|---|---|---|---|---|---|---|---|---|---|---|
| ADC Value | 333 | 334 | 335 | 336 | 337 | ||||||||
| Occurrences | 1 | 74,472 | 4,582,727 | 370,414 | 3 | ||||||||
| Z-axis | |||||||||||||
|---|---|---|---|---|---|---|---|---|---|---|---|---|---|
| ADC Value | 389 | 401 | 402 | 403 | 404 | 405 | 406 | 407 | |||||
| Occurrences | 1 | 1 | 314 | 257,404 | 4,073,165 | 696,663 | 67 | 2 | |||||
Apart from a couple of outliers, my data logger had recorded a range of six values from 401 to 407 in the z-axis for a ~4.9 magnitude quake. Underwhelming, to say the least. Either something wasn't working or my understanding of something was wrong. Time to do some more reading.
After some further reading and some calculations it turns out that each time the value changed by one it represented a fraction less than one percent of the force of gravity. Once I discovered this I then found some sites with more information about the relationship between "peak ground acceleration" and MMI scales. Acceleration of 1-2% of gravity is apparently at the point that shaking is noticeable ("strong motion"). The values I was seeing were consistent with a magnitude of 4.0-4.9, intensity I-IV or 1.4 - 3.9 % of gravity.
I was successfully detecting earthquakes. The numbers just weren't very impressive.
Displaying the Result
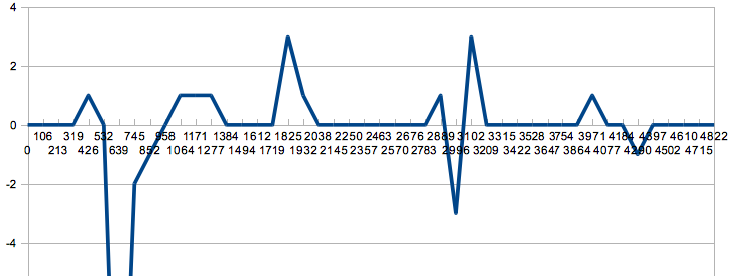
After the massaging the data in a spreadsheet I could graph the results for the most intense period of activity (about 5 seconds) in all their less than awesome glory:
Plot of raw ADC value for each axis over ~5s time (yellow = z, red = y, blue = x)
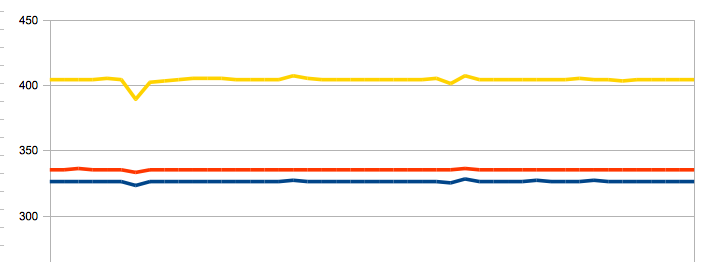
Plot of relative ADC value for z axis over ~5s time
And there you have it, a successful if underwhelming result!
What Would I Do Differently Next Time?
I'd probably try to get an accelerometer with a narrower range which would mean a higher resolution within that range. The Accelerometer and Gyro Buying Guide has a number of options in the +/-1g or +/-2g range which would (hopefully!) be more than enough for any aftershock. That means smaller movement could be detected.
I'd also take better advantage of the existing range by using the Arduino AREF functionality to restrict the values from 0 to 3.3V thus improving the resolution.
Another option would be to consider a higher-resolution ADC than the inbuilt one but there is a point where (especially since this is all on a breadboard) the increased resolution would obscured by noise.
I'd also work out a way to have a proper time-stamp on each sample.
Your Turn!
Have you ever tried recording a natural phenomenon like earthquakes?
How would you process the large amounts of data a project like this can generate?
I'm not a geologist nor have I developed many data logging projects, do you have suggestions for how to improve this project or writeup?
Got your own story to share about a project with less than spectacular results?
Leave a comment and let us know...
It is great! By the way, we have got a case on seismology thru RPi as well )))To learn the project read our blog post => https://goo.gl/TDH9qB (copy and past into browser)
have you tried https://www.iris.edu/hq/programs/education_and_outreach/software/jamaseis We have that hooked up to our TC1 and its great.
[HELP] if ricther scale formula is log ( 10 * Data entry sensor ) how do I implement it on arduino if I use the accelerometer ? at the moment I am using a piezoelectric
Hello fellow Kiwi! I live in Wellington and had a similar idea recently after the earthquakes centered near Seddon which were strongly felt in Wellington too (see http://en.wikipedia.org/wiki/2013_Seddon_earthquake). I connected a +/- 1.5g accelerometer to an old Arduino Mega I had lying around, blu-tacked it to our stone fireplace in the lounge and connected it (via USB) to a laptop for both power and so I could use a java program on the laptop as a data logger. I was pretty chuffed with myself, was getting a sample rate of 366 per second for X, Y and Z co-ords. However, lots of noise in the readings meant it was hard to figure out if a real quake was happening (we get heaps of small quakes here, just like you guys do in ChCh (of course). Plus of course, as soon as I built it no major aftershocks came (for weeks...). I was about to unplug but then a few days ago we had a Mag 5.1 which rumbled through near Seddon, which was strongly felt. I ran to the laptop (after checking the kids were OK...) and grabbed the data file. It was a beautiful trace of the quake passing through my house. The best thing I found was that I could analyse a whole heap of things by correlating the data with the official GeoNet data. For example, by checking the timing difference between GeoNet and my accelerometer you can calculate the speed of the wave, calculate the peak acceleration, velocity and distance your house moved! Frequency of wave is also clearly determinable (try FFT command line on linux to get a fast fourier transform of the data). I have some cool charts too, but can't figure out how to upload them into the comment. If anyone is interested in me putting together a posting like the article above reply to this post and if I get enough interest I'll make one. However, just so you know it IS possible to get meaningful data about how your house is impacted in an earthquake from very low cost accelerometers and an arduino :)
Sweet! I'm going to try and build this all together to make a logger for amusement park rides. I'm going to be working at a large park this summer, so I'll try to get as much data on as many rides as I can :)
I'm brand new to the world of Arduino - but I'm a programmer used to dealing with large datasets. I live next to a steel factory and am interested in building a seismograph to measure the weekly rumblings coming from the plant.
With regards to getting high volumes of data to a server, I was recently playing with a gaming server framework called Photon (http://www.exitgames.com/). It basically is a soceket server that can listen to high volumes of data per second (think about the amount of data transfer needed to allow massively multiplayer online games).
Anyway, it would be possible to send some data to a server in this manner (though I still have no idea yet how data makes its way from your Arduino device to the outside world...still learning).
R
Would you recommend an accelerometer to measure vibrations from cars passing an object on the ground? What would be a good range?
This is a really neat project. I think I've been inspired to create something I'll probably have to let sit for a couple of years before I catch anything. It's a shame, there was an earth quake just a few months ago.
A few things I would do differently and add that haven't been mentioned: -I would think mounting the project to a sturdy base would be important, say, the bolting it to the basement floor? -A C# e-mail client that uses my gmail to forward alerts via text message if the project senses anything I've told it I care about. -A small UPS, maybe just a LiPo? How disappointing would it be if a 9 Richter came along and tore the power lines down and I missed all the after shocks! -Data management. I probably wouldn't want a million 0's to be stored, I would still sample at a high rate, but maybe only store a snap shot every couple of minutes until an abnormal reading occurred and then store continuously until 24 hours of normal activity passes. -Say I use three stations as Orcinus suggested, perhaps integrate an algorithm to calculate the epicenter on the fly and have it sent to my phone. That would be NEAT. But wouldn't I need four stations to calculate the depth of the epicenter?
Anybody have ideas to add to that?
I first used the ADXL345 with my first seismometer. The sensitivity was okay. My next revision uses the BMA180 accelerometer, which seems to have noticeably less noise.
I have the data sent from the Arduino to my low power computer, and it writes the data to its hard drive. It zips the data inline with Java. The old one recorded at 200Hz, and the latest one records at 150Hz. My Java graphing program can do a lot more analysis than the Arduino. The 200Hz compressed data is about 23MB of data per day, but the generated pictures is about 75KB.
My current ADXL345 based seismometer has only been able to noticeable and correctly record one 4.1 earthquake.
Details and results can be found here:
http://www.centralnexus.com/seismograph/
Great Article! I found this because i noticed the referral traffic to nimbits.com - I'm the architect behind nimbits data logger. I'd like to try to address the limitations of having x number of readings per second, and getting that data into the cloud. App Engine 1.4 SDK just came out that claims to have a real time API connection. I'm playing around with that. If I can help you with this project, please let me know. Cool stuff!<br />
<br />
Ben<br />
www.nimbits.com <br />
Couldn't you mechanically amplify the data by putting the sensor on a long pole or stick? Not sure how you would calibrate any of the home devices
"Couldn't you mechanically amplify the data by putting the <br />
sensor on a long pole or stick?"<br />
<br />
Perhaps, but the challenge would then be complicated by the additional harmonic resonances caused by the mechanical apparatus. This would cause a variable sensitivity of the detector as plotted over frequency. If there was any play in the mechanical system, it would also introduce non-linearity to the sensor system which would further corrupt the signal integrity.<br />
<br />
Selecting a sensor that provides a higher signal to noise ratio to begin with will likely lead to better results.<br />
<br />
Thus the recomendation of a geophone or similar sensor.<br />
<br />
They are based on a much larger reference mass, so for a particular acceleration on their sensitive axis, they will output a much larger signal than a MEMS based accelerometer can.<br />
<br />
Hope this helps.
If I remember right the USGS was having the inverse of the problem followr is having back with their data sets on the last California�s San Francisco earth quake. They were able to get real fine detail with some of their sensors, but when the big jolts came they were missing out on how big they were (if I remember right they were in the dark how big things really shook in real time). Followr have you tired contacting them and asking what they have found helpful both on compressing the signal and capturing the full spectrum of seismic signal? I know here in Washington State, the University of Washington seismology lab has answered many of my questions. They might help you in narrowing what works, plus I bet they would be interested in what you�re trying to do. It would not surprise me that they would want something like this project in help monitoring areas that they normally can�t monitor.<br /> <br /> <br /> Wouldn�t be funny if there could be a cheap way of setting up a school network tied to the internet around an area like Washington State to monitor the Cascadian plate, or any place earth quakes happen. In addition, have that data set available to anyone. What would really make this exciting is if something like the USGS could have some type of �Cloud� that was able to store all that data in it�s full spectrum (both fine detail, and what accelerometer gross detail can show)- and have it Open Source so anyone can look at it and use the data. <br />
See this site for some information on an earthquake monitoring project. (http://qcn.stanford.edu/)<br />
As bsmithyman says, the key issue is the frequency band. Accelerometers are way way high up w/ regards to their freq. response, compared to a seismometer/-graph. The oscillating mass they typically use is tiny, as well as distances and travel lengths involved.<br />
<br />
Which gives me an idea... How about using a piezo vibration sensor and "tuning" it in with an appropriate oscillating mass? They also have a much wider dynamic range than an accelerometer so would be harder to overload.
BTW, funny thing... i've got the idea of using an Arduino as a makeshift seismograph last night. Talk about a coincidence.<br />
<br />
Anywho, here's an upgrade of the idea.<br />
<br />
How about installing two or three of them in multiple places across the town (home, work, friend's place)? With a sufficiently high base length (quakes typically exhibit frequencies between cca. 0.1-10Hz => so approx 3km-30m apart) and a sync, you could do some basic triangulation on the epicenter.
Yep, in fact if you went with a fair bit more DSP processing power, you could do cross-correlation of the signals and filter based on azimuth, for example. An example with data from New Zealand: http://citeseerx.ist.psu.edu/viewdoc/download?doi=10.1.1.70.6544&rep=rep1&type=pdf<br />
Or another using the USArray deployment in the western US:<br />
http://ciei.colorado.edu/ambient_noise/
The issue is partly one of sensitivity -- like Eric-Montreal says above -- and partly one of bandwidth. Accelerometers are nowhere near as sensitive to low-frequency signals as even a mid-band geophone, so you're only going to get the spiky high-frequency portion of the signal.<br />
<br />
I'd suggest taking a look on places like used equipment suppliers; try to find a seismograph or geophone with a 1 Hz low-pass (or lower). The output will be a signal you can amplify and measure with an ADC, and the size and weight will be sufficient to keep it a bit more stable. If you want to get really serious, you could talk to GNS science and see if they have anything used that they're looking to get rid of (http://www.gns.cri.nz/). They've got offices in Wellington and Dunedin among others.
A real seismograph is much more sensitive than a regular accelerometer and it's sensing mass is much higher. No matter how precise the ADC is, movements will be well below the noise floor of the accelerometer. It's a bit like trying to do a biology analysis with a magnifier instead of a microscope.
I just added a similar comment to the news post, but:<br />
<br />
There's a really good diagram illustrating how seismographs compare to accelerometers that I didn't include in the tutorial.<br />
<br />
I've got a screenshot of it here: http://is.gd/ioiMj<br />
<br />
The diagram comes from a paper "Using Micro-ElectroMechanical Systems (MEMS) accelerometers for earthquake monitoring" available at http://www.aees.org.au/Articles/Pascale_MEMS.pdf