
Graphic LCD VU Meters
Seeing Sound
Some time ago, I drew the project of creating a new serial backpack to replace the one we used to sell. I hadn’t done much with graphic LCDs to date, so I was somewhat stoked to do it. And in the back of my head, rogue elements began to organize…
I soon met the LCD of interest: this 160x128 pixel white on blue monster that we sell. “Huge” we call it, and huge it is. After a few preliminary conversations with the Spark-brothers, the serial backpack takes shape. I work up a design, layout a board and send it out. In my head the gears are grinding happily, while other ideas take shape. And that shape? A super-huge VU meter!
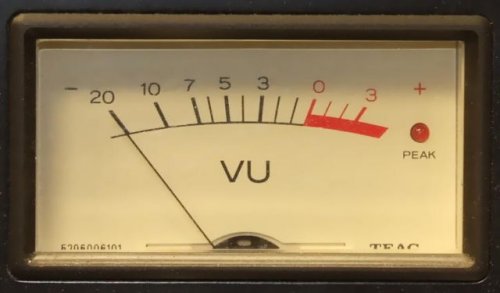
If you find yourself asking “wha…”, let me try to clear it up. A VU is a volume unit. A VU meter is device that bears a logarithmic scale from -20 to +3 VU, where 0 is equal to 1mW into 600 ohms (sine wave, 1KHz specifically). Further, the meter has a time constant of 300mS, so it’s got a sort-of slow response time. It’s also got a red LED that indicates “peak”. When that thing lights up, you know you’re loud.
These things were popular on older audio equipment. And you can still find them, they’re just not as prevalent as they once were.
Before I go too much further, I'll admit that, strictly speaking, I did not make a VU meter. I made something that would be more accurately described as a level indicator. This thing is just full of cheats. If I wanted to do the legwork, I could make it a true VU meter. But what I've got is close enough for me, at least for now.
But back to the story. Backpack protos got sent out, came back, built up, electrically tested and I was working on code. Mapping the LCD was simple: lower left is low memory, upper right is high. All I had to do was map it to Cartesian coordinates. The LCD actually has its own text generator, but the characters can only be in specific places on the screen. I wanted to be able to put text anywhere. So I jacked the text from the Sinister 7 project, wrote a pixel write/erase function and based everything else on that. Circle and line functions quickly followed, and I knew my time had come. My quarry was within striking distance.
The Hardware
Let's first define the problem. I've got an AC signal that I need to turn into a simulated needle movement. Where am I going to get the signal from? The definition of a VU meter necessitates taking it from the source that's driving the speakers. But I've got a thing about putting things parallel to my speakers, so instead I'll take the signal from my computer audio output. That signal's likely to be in the hundreds-of-millivolts range instead of volts to tens-of-volts, and it's a lot more convenient logistically (my computer is closer to my desk than my amplifier). It's already not a true VU meter. That lasted long.
OK, I've got my signal, now what do I do? Well, the meter doesn't measure frequency, it measures magnitude. How do we get magnitude from an AC signal? We rectify and integrate, and therein lies our first problem. The signal is small, like a few hundred millivolts. Any diode is going to have a forward voltage drop comparable to that, so we're going to get a whole bunch of nothing if we try to rectify directly. Therefore we need some gain. But no matter how much gain we give it, we're not going to register the smallest signals without enough DC offset to overcome the diode drop. SparkFun sells an op amp breakout board that's just begging for this sort of hackery.
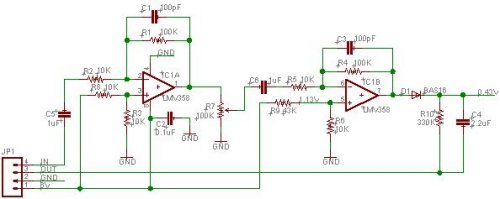
Above is the op amp breakout schematic with the changes that I made. R9 has been changes to 43K to give me an offset of 1.13V instead of 2.5V and D1 has been added to rectify the signal. With no audio coming in I should get about 0.43V DC at the output. The values of R10 and C4 were originally selected to give me a time constant of 300ms (330K and 10uF), but I found that too slow for my liking. Now they sit at 330K and 2.2uF, and that looks like a pretty realistic needle movement to me. The last thing to mention is that I'm running this at 6V, which is the same as the LCD backpack gets. It's a little on the high side, but nothing's smoked yet, so...meh. It works.
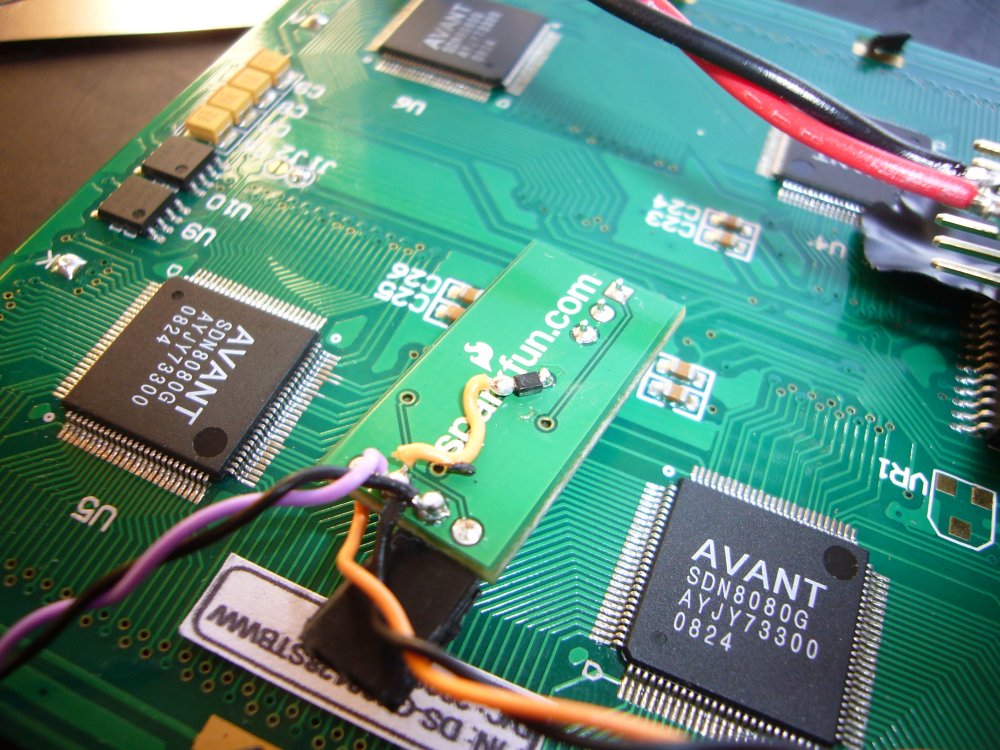
Above shows the installation of the BAS16 diode used for rectifying the audio signal. I cut the original trace to the output pin, found a via, scraped off some solder mask and pinned the diode to it.
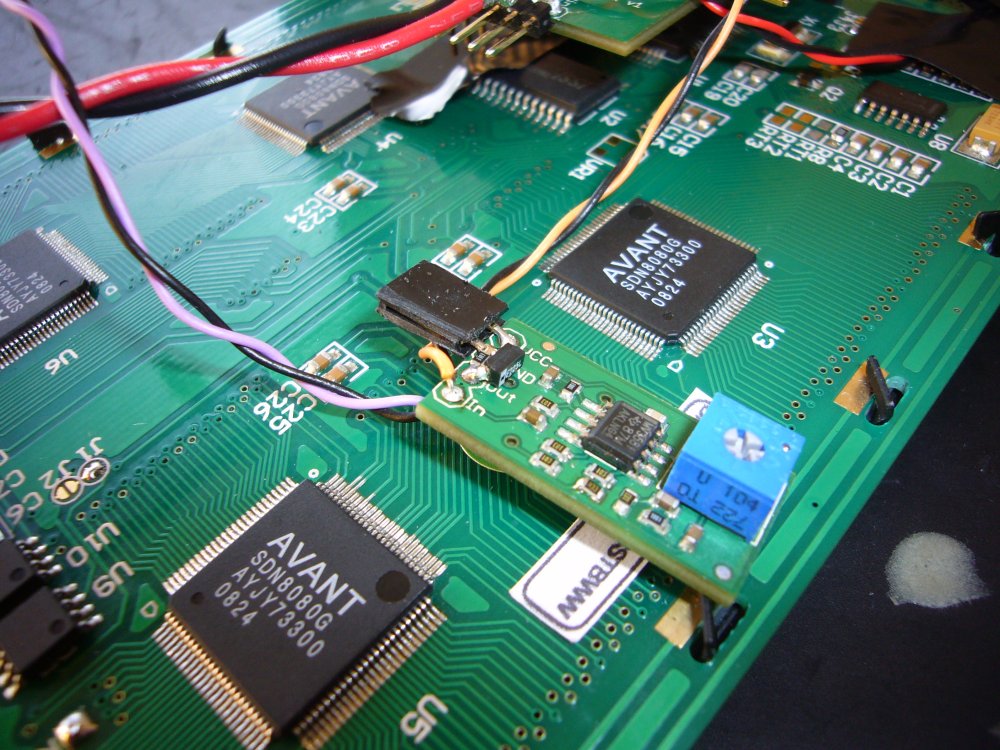
The picture above shows the installation of the 330K resistor and the 2.2uF cap between the output and ground pins. I also put a 2-pin female header on it to make it easy to plug into the backpack to steal power. The output from the op amp board is wired straight to an unused ADC line on the ATMega168 that’s on the backpack.
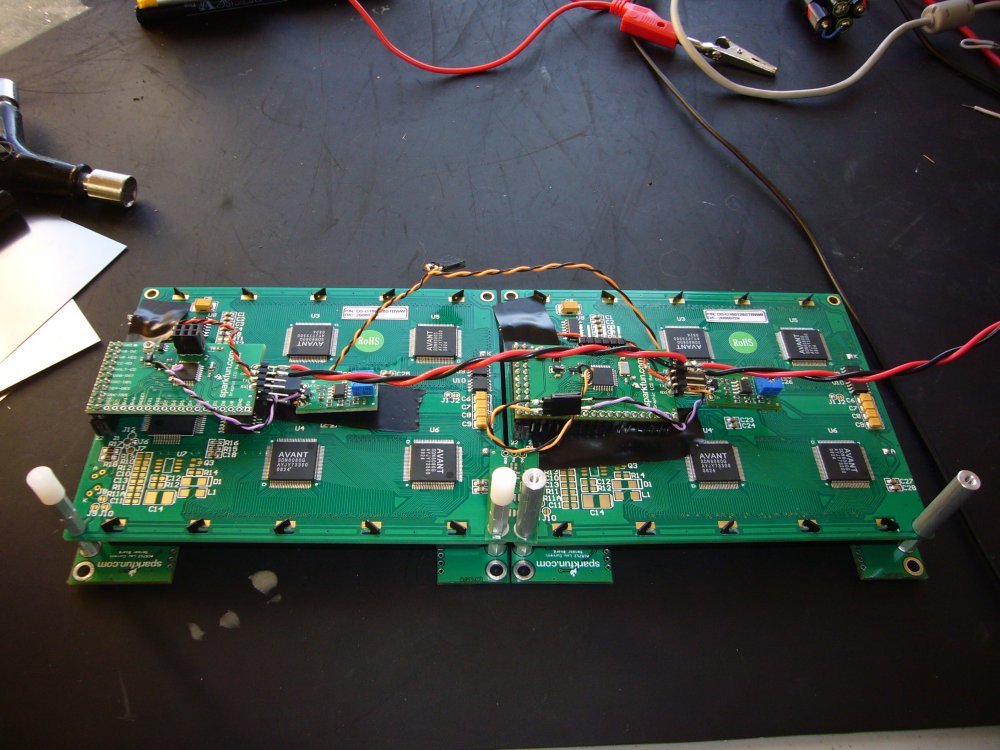
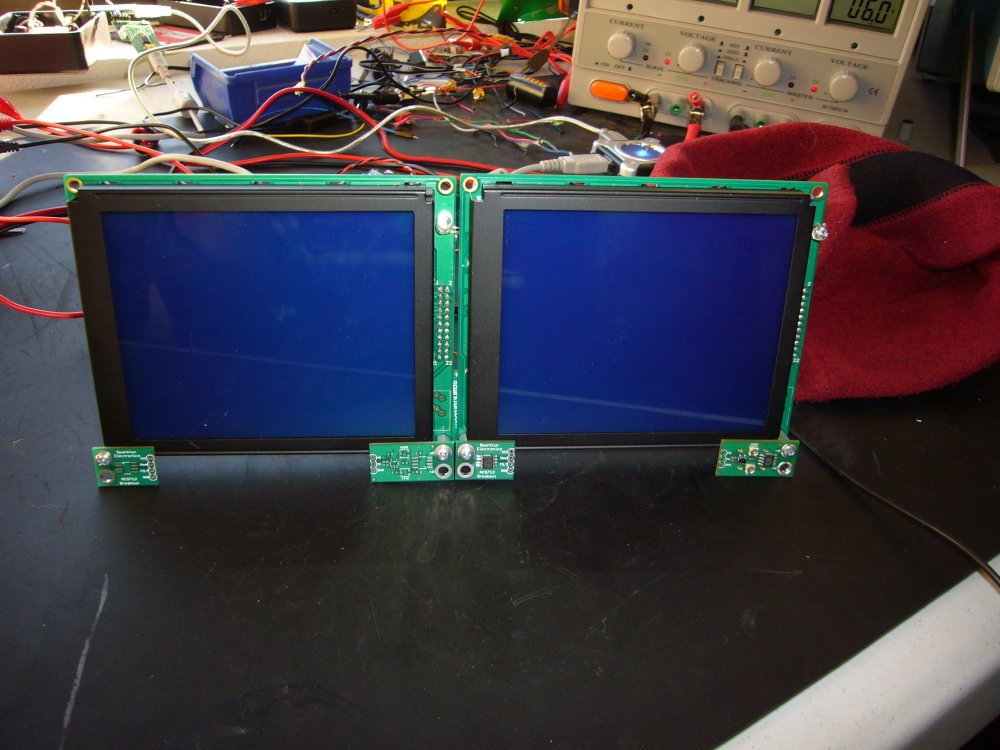
The above picture shows 2 displays with 2 backpacks and 2 op amp boards (for left and right channels), all held together with an array of various old circuit boards and standoffs so the whole contraption stands up in some kind of halfway appealing way. The picture below shows the front side.
If you’re curious, the extra circuit boards are prototypes of the ACS712 current sensing boards. Can’t sell them, so might as well do something useful with them. You may also notice my peak indicator LEDs near the top right of each display. Nothing fancy, just held on with good ‘ol ‘lectric tape.
The Code
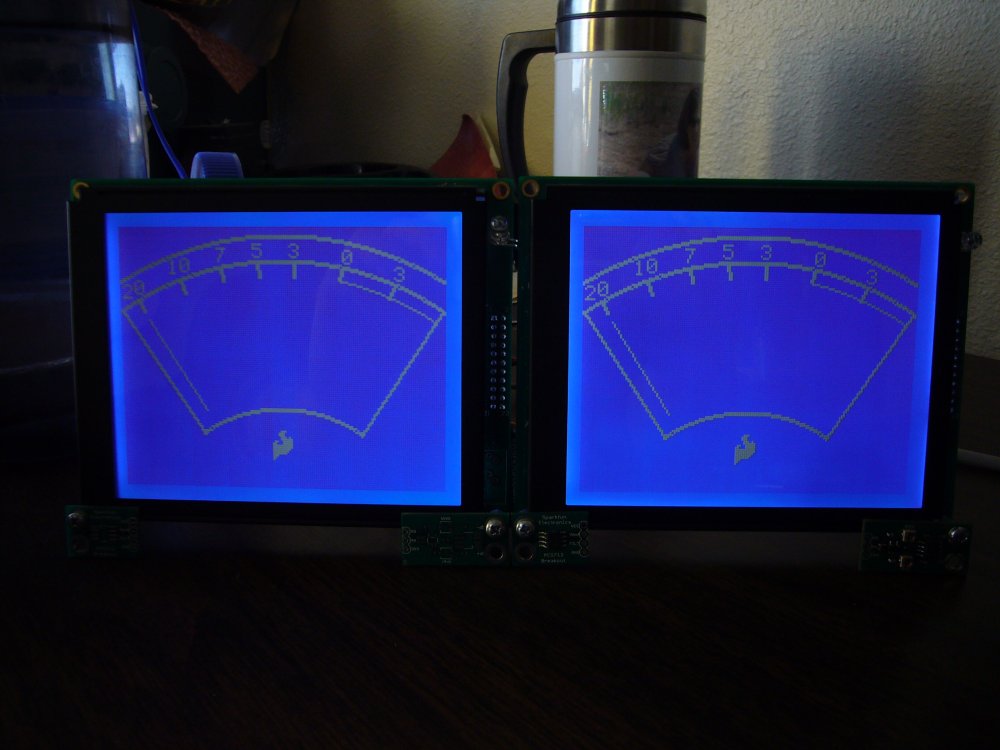
The first thing I had to do was to draw a picture of a VU meter. Not too complicated, but I’ll start with a picture and describe what I did.
By the time I started this project, the LCD backpack code already had line and circle functions (both of which use the pixel function to draw) so I just had to augment it a bit to make the meter outline.
Originally I had intended to use the circle function to draw my arcs, but ultimately just used the circle equations themselves to get the job done. Source code will be posted with this tutorial so you can see exactly what I did, but I’ll paraphrase it for you here. Each arc is actually two arcs to make the lines double thick. The arc is drawn by setting up a circle with its origin below the screen (y = -30) at a given radius between a range of x values. The top arcs go all the way across the screen, so x is from 0 to 159. The bottom arcs are from x = 40 to x = 120. Then I drew lines between the endpoints of the arcs to give the meter a border. Number and hash marks were placed by good ol’ trial and error (and you’ll notice I haven’t bothered to put minus signs on the numbers left of zero - the needle movement is the most interesting part of this anyway).
Now let’s define the needle movement. The top and bottom of the needle follow arcs with the same origin as the other arcs that make the meter. The easiest way I could think of to draw the needle was to calculate an x value that corresponded to an ADC input, give it a y value according to the top arc, then calculate a corresponding lower point along a smaller, bottom arc and draw a line between the two points. When I needed to move the needle I could just erase the first line and draw the second. And while that seemed a pretty slick way to get the job done, it was also the slowest. In the end I made a lookup table for the lines to speed it up. I just made my code go through the arc calculations and spit the values out the UART to my terminal, then copy and paste into my code.
The needle position is updated every 10mS. I founds that a pretty good compromise between accuracy (ha-ha) and the visual persistence of the LCD. Since the hardware has the time constant built into it, I don’t have to do any averaging or other calculations. The code just reads the ADC and assigns it an x value. If it’s changed from the last time through the loop, I erase the previous line and draw the new one according to the lookup table. And if the x value is above a certain point the peak LED is lit.
Final Thoughts
To be technically correct, the x value taken from the ADC really ought to be calculated by some logarithmic equation (you know, since the meter is read in dB and all). But I’m a busy guy, places to go, people to see and all that. And I said at the beginning that this thing was full of cheats, so there’s my official disclaimer.
I’ve figured out that the meters look better in reverse mode, blue on white, and that’s how I run them now. The needle movement came out more visible than I expected it would, and it’s pretty smooth, too. If you like mixing your analog and digital together, I think this is a pretty fun project. Here is a Youtube video showing the meters in action:
Feel free to post comments or shoot me an email.
pete at sparkfun.com
The link for the source code is broken... Please fix it! It would be immensely helpful!
I second that.
bump for source code justice!
Link to the source code of the backpack is broken :(
i'm having some serious troubles making anything display quickly and nicely with the 128x64 glcd with serial backpack. it might be programming, i don't know. i send the commands (i.e. 0x7C) one line of serial.Print(0x7C,BYTE) at a time and although it (50% of the time) sends the command OK (some are lost resulting in random behavior), everything occurs too slowly to use fluidly. even clearing the screen (0x00) and reprinting can't be refreshed quickly without making the display illegible. i, and apparently others, badly need example code to see where we're going wrong!
other than that, the LCD is very easy to interface with :)
They look pretty good and the needle is nice and responsive too which definately makes it worthwhile... The project isn't as cheated as it could be.... if it were me I would have created a look up table for the meter outline as well... but where is the fun in that right?
:)
Muzza
Question: The code is not up, so what voltages are you getting at the output? How well does this circuit behave for beat detection (for flashing lights to music and such)?
Can you run these glcds with a PIC16F877?
AWESOME ! YOU ROCK !
I know I'm a bit late to this Arduino post. For starters I am a total noob at Arduino, but learning as I go, so go easy on me, also please keep sarcastic comments to oneself. I was trying to make a VU meter from my graphic LCD display. One thing you left out is what did you use to draw graphic lines on your LCD?
Check out our Learn tutorial here for the line commands.
How did you program this? What program did you use?
Can you point to instructions on how you set up your code development area?
It does not look like you used AVR Studio?
The serial LCD source for backpack based LCD is here. It has VU code, looks like just a standard set of C + Makefile:
http://www.sparkfun.com/Code/Graphic%20LCD%20Backpack%20-%20ATMega168.zip