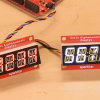
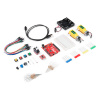
There's a new tutorial on the block! SparkFun’s Displaying Sensor Data Over Bluetooth tutorial expands on the concepts covered in our recent Sending Sensor Data Via Bluetooth tutorial. Rather than simply outputting data on the Arduino IDE serial monitor, our newest tutorial covers how to display data from a KX132 Triple Axis Accelerometer through three different avenues, and we take you through each hardware AND software setup.
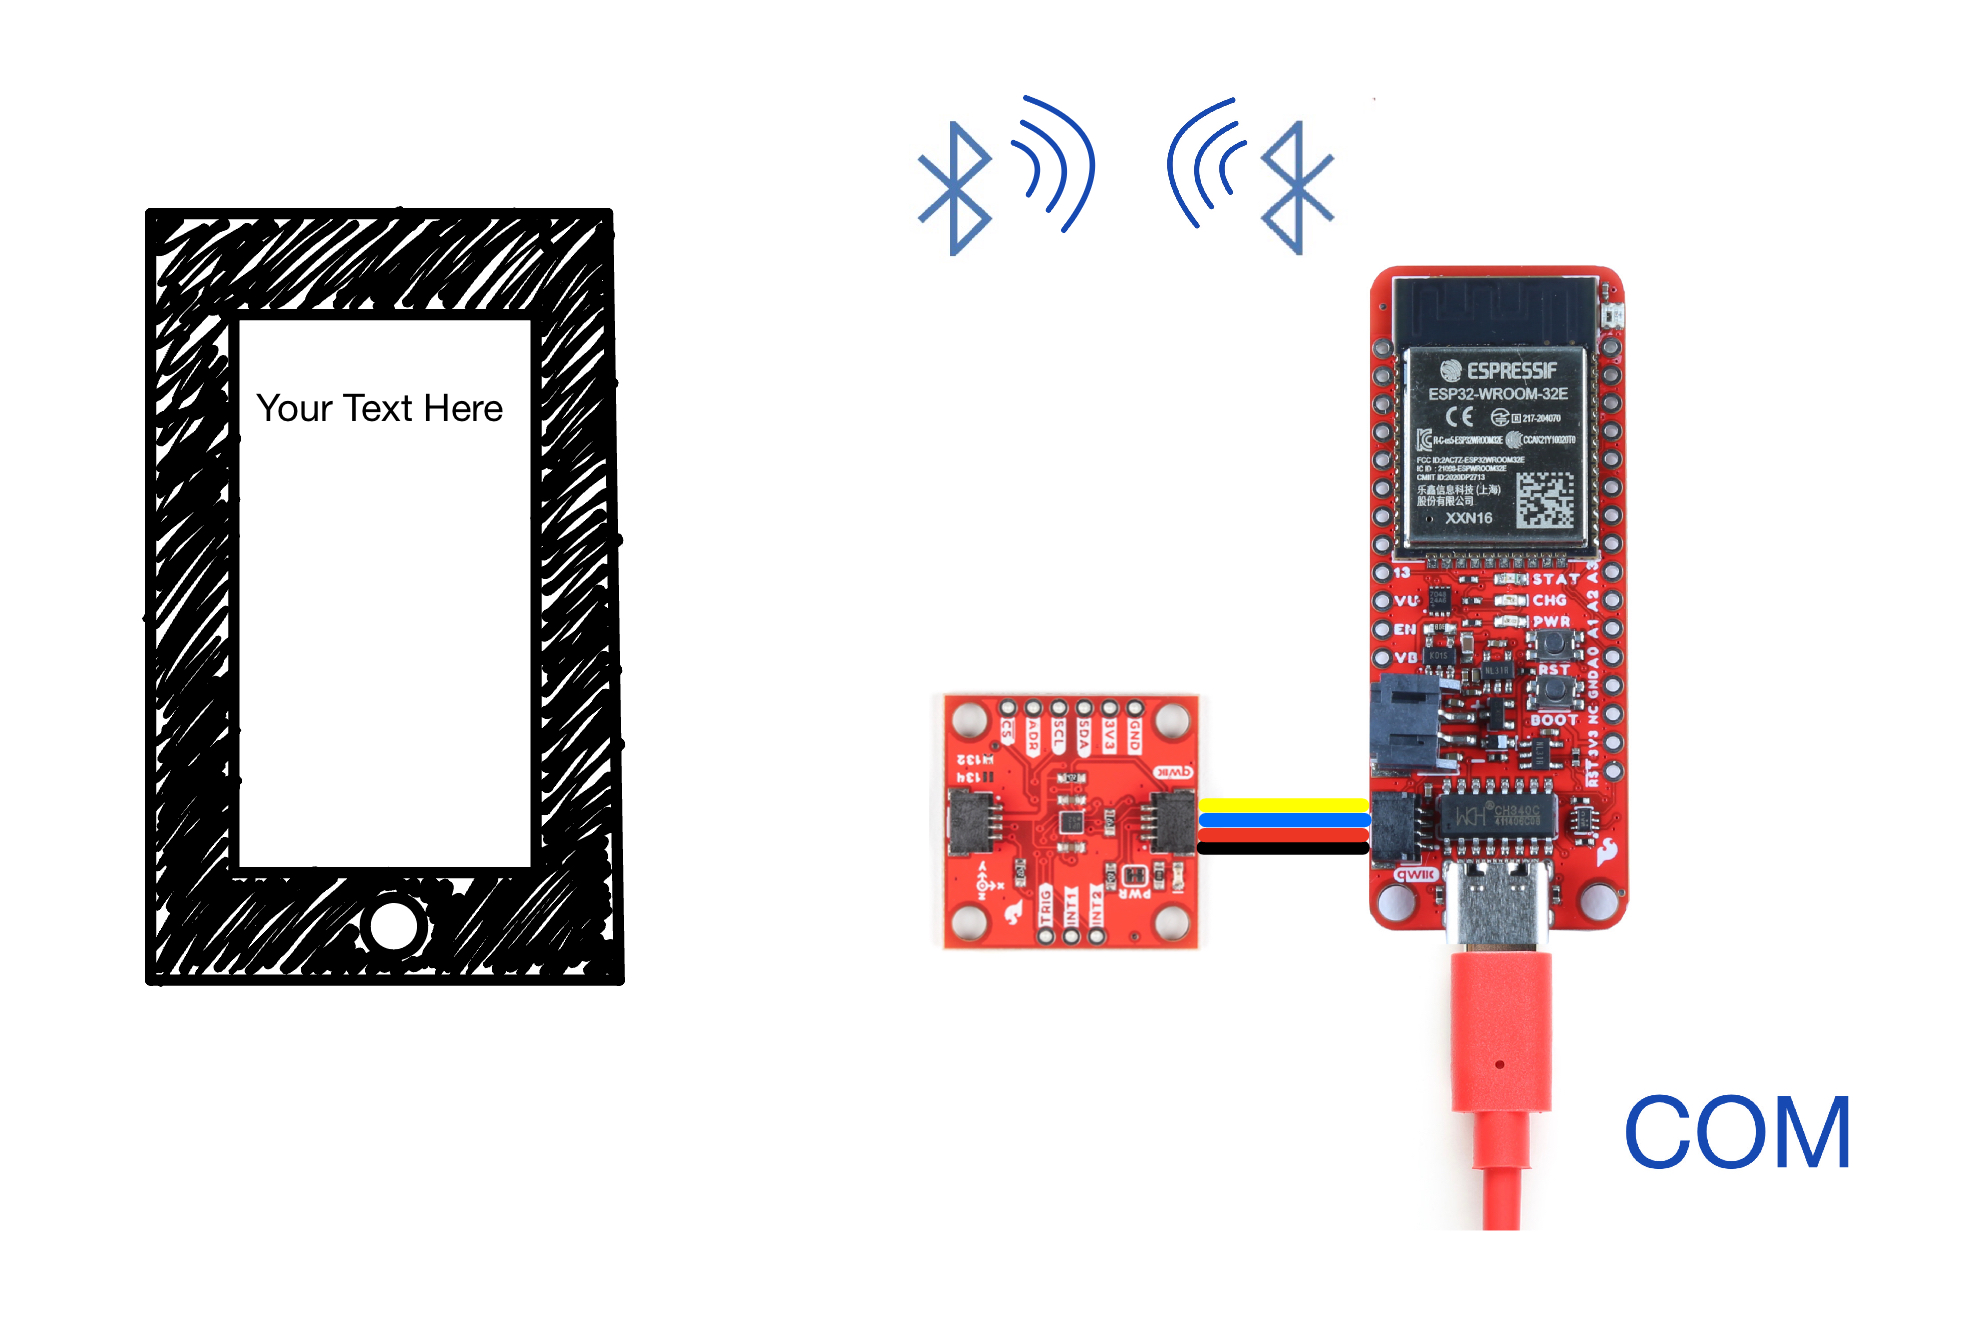
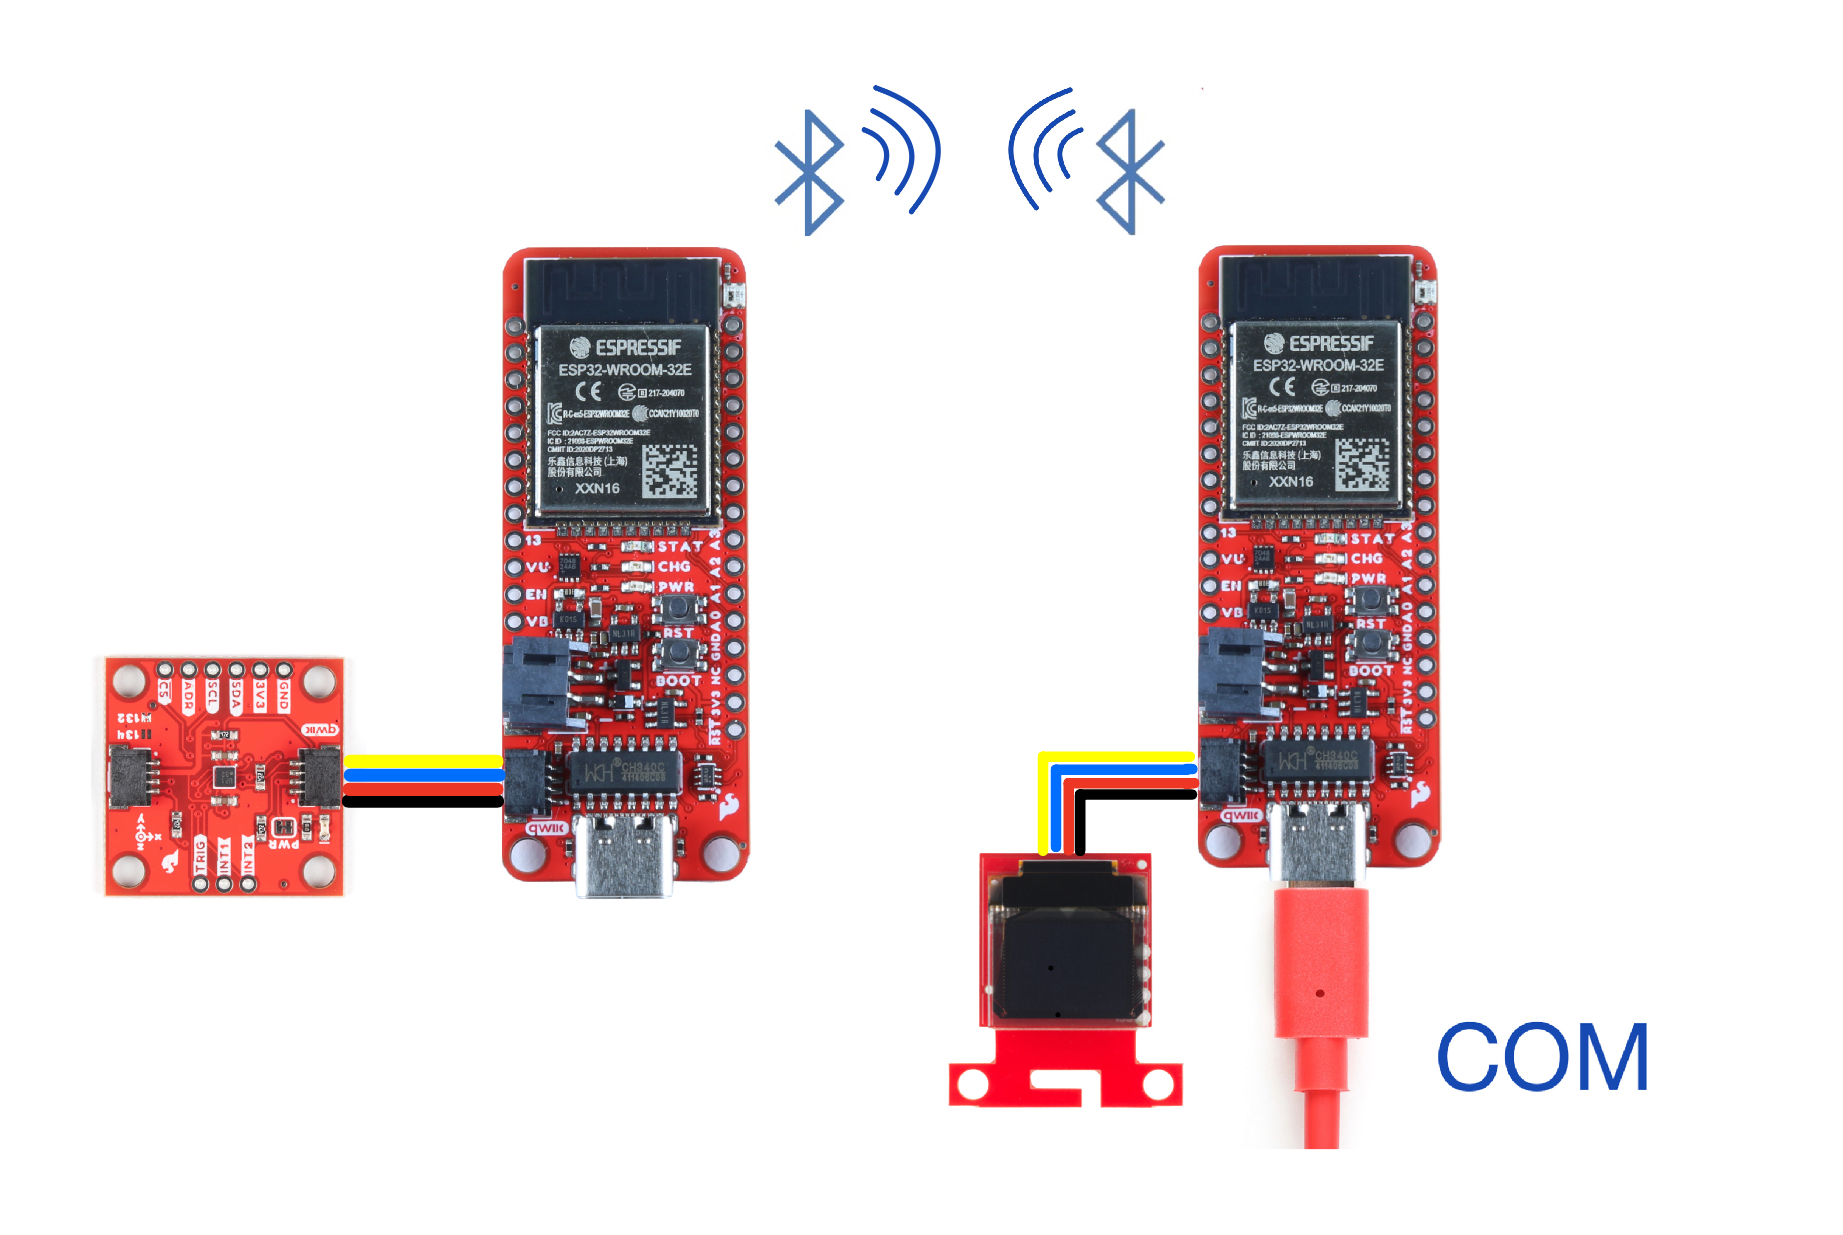
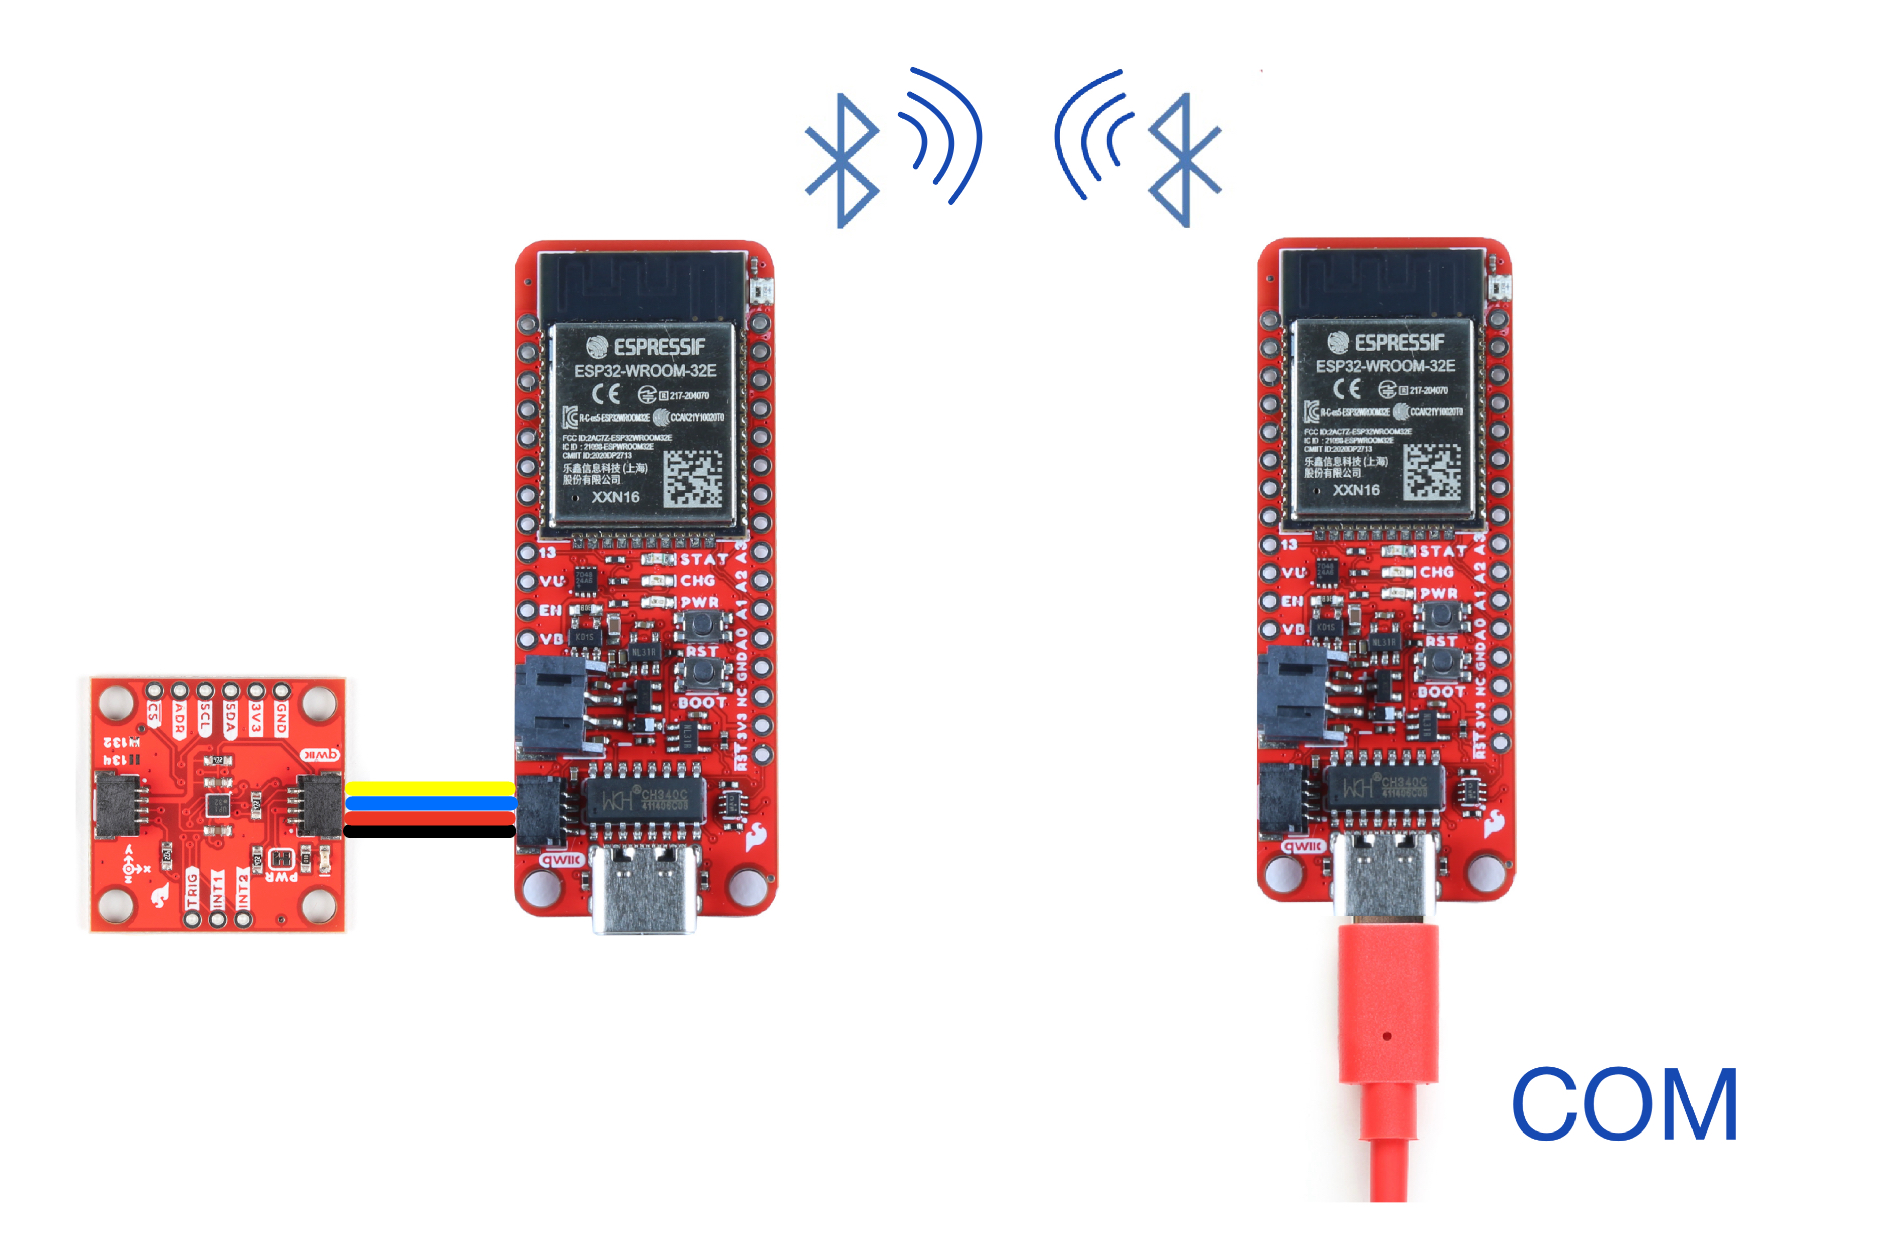
If you’re looking to get more involved with using Bluetooth in your projects, or find new ways to look at your data at a glance, then this is exactly what you’ve been looking for! By following the steps outlined in this tutorial, you will learn how to display accelerometer data with a live python graph, a mobile device, and an OLED.
This tutorial was developed by a team of high school students from The Innovation Center at St. Vrain Valley School District. Special thanks to Frances Hudson, Aidan Lawall, and Jonathan Otte for their work on this tutorial. The Innovation Center is an educational center in Longmont, CO that connects students to real-world experiences in engineering, aviation, robotics, media production and more.


