
Welcome to a special edition of Enginursday! Why is it special, you ask? Well, because I'm not actually a SparkFun engineer. I am here to bring you a cool new tool though – a few months ago one of our engineers commented that he had found these sheets online and it would be great if we had something similar on our site. Having used them quite a bit while in tech support, I agreed. While they are open source and we could have used them, we didn't have much control over them and they may or may not exist for the products we wanted. So I sat down to figure out how to make our own.
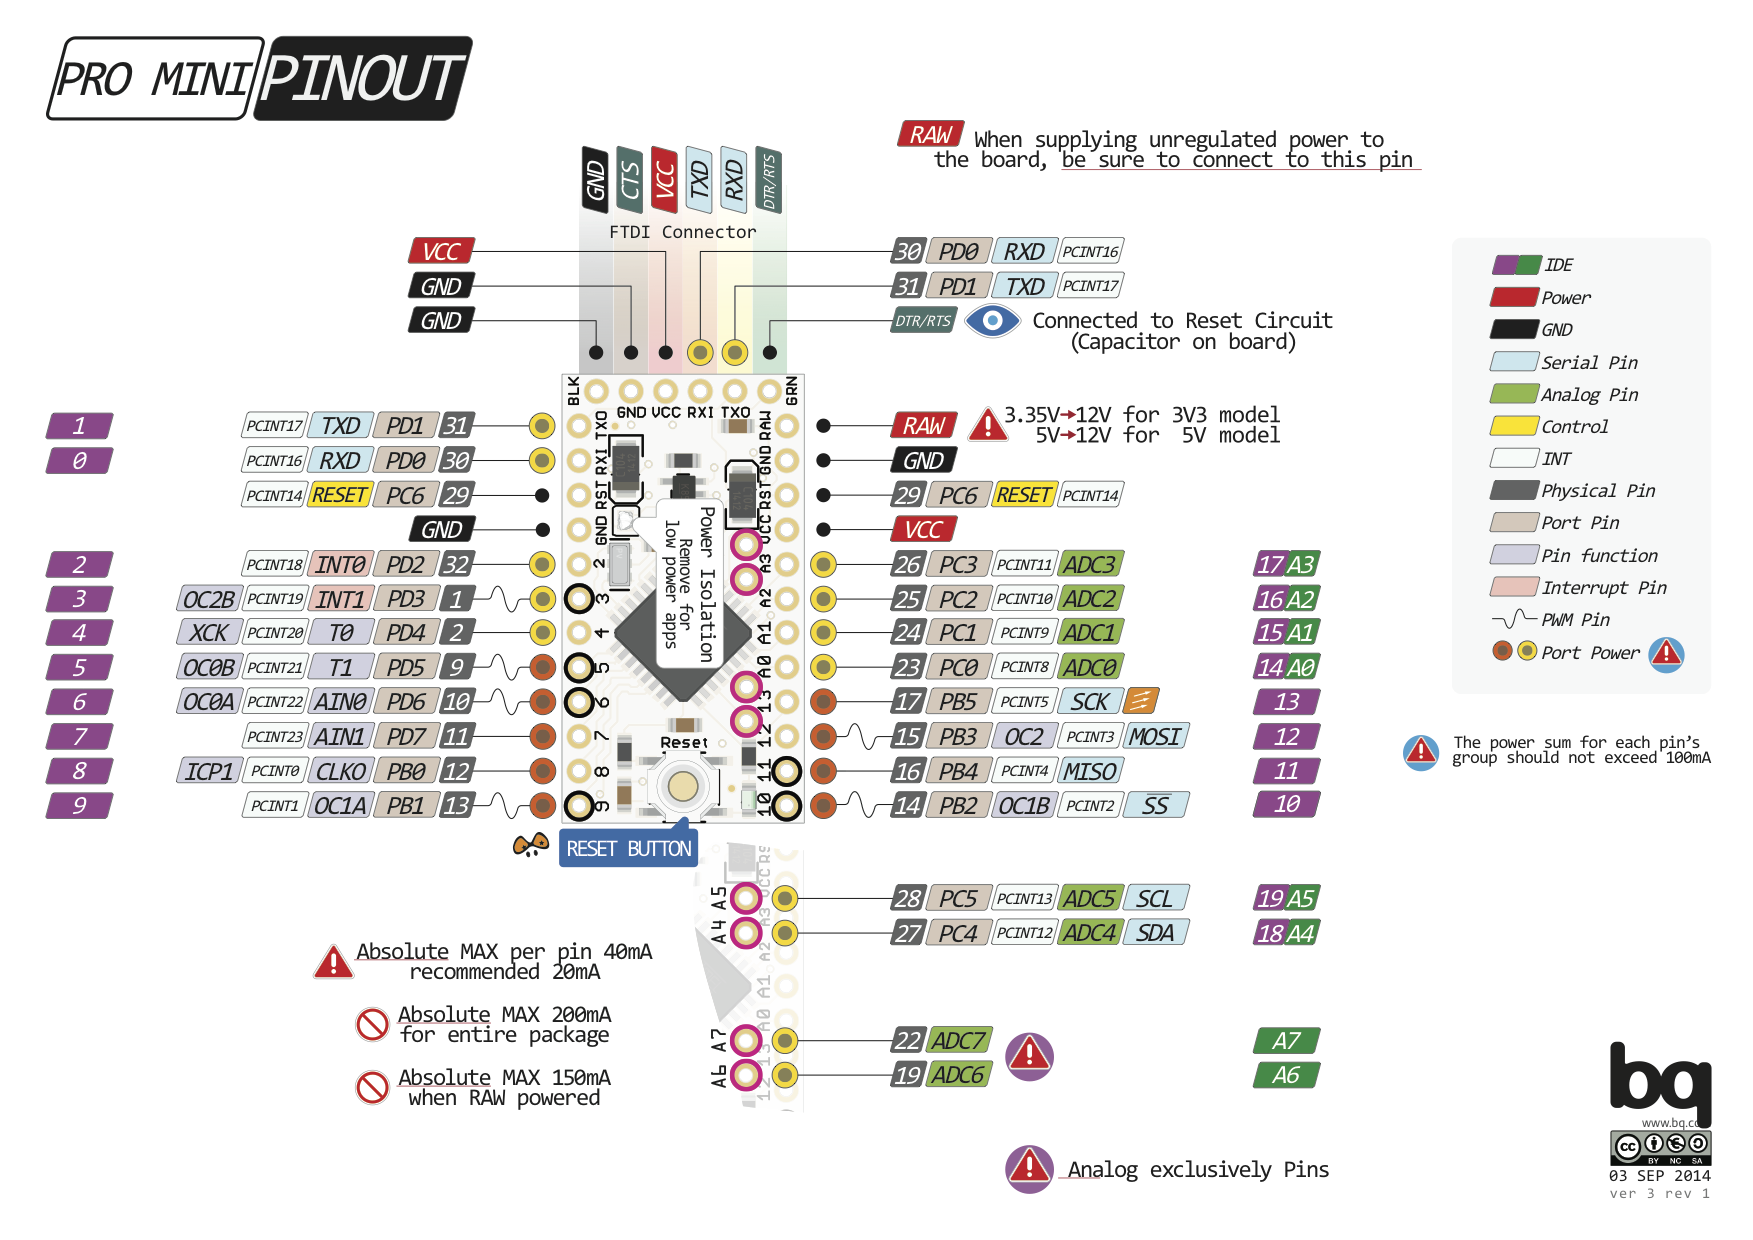
Sheet for the Arduino Pro Mini from Pighixxx
The first thing I noticed was that I would never get all those boxes lined up on my own. After deciding on SVG as a final format I found an SVG library and dug into Python. Before you grill me too hard on my sloppy and inefficient code, keep in mind that it does what I want, and I didn't know any Python before I started.
#!/usr/bin/python
#http://www.astro.ufl.edu/~warner/prog/python.html  - Python Basics if you want to learn some Python
#https://pypi.python.org/pypi/svgwrite/  - Library this script uses
#install Python27, download svgwrite, from svgwrite folder run "C:\Python27\python setup.py install"

# This script starts by asking for a file, this name is saved as 'myfile'
# Input file is a 'myfile'.csv and is referred to as file
# Be careful what characters you use.  This is a comma deliminated file, so using a comma
# in your text will cause problems.
# Also, some applications will change characters to non-standard characters
# you will get an error (" - " is often to a larger dash that is non standard)
# Output file is a 'myfile'.svg and is defined before the while loop
# The script is setup for 13 fields, to add more change the global fields variable
# and add another section to the writeField function with the colors you want.
# If the following words are in field 1 of a line it will change the structure
# of the output blocks to fit that heading "Left, Right, Top, Text, Extras"
# Text will not make a box, but make a new row of text for each field, each line will
# be a different section of text, this section must be after blocks
# Extras will look for a file in the folder /Images called value.png and add it to
# the svg, useful for things like ISP headers graphic, etc. (I'm not actually using this)
# File is read until field 1 is "EOF"

import os
import svgwrite
import time

############################################ GLOBAL VARIABLES #######################################

row=0 #row starts at the top
height=12 #height of a box
width=45 #width of a box
rowheight=15 #height of a row (leaving enough space between rows to move)
rowwidth=48 #width of a 'spot', basically width plus a few
fields=13 # number of fields
documentWidth = rowwidth*fields +50 #maximum width the document should be
documentHeight = 2250 #this is  guess since we need to make the document before
#we know the file size, doesn't really matter anyway
direction = 'r' #which direction the tag is facing, staring out with labels on the right
offset=0 #this is where we start, for the left we will start on the right side of the page
previoustext = 0 #for text function, defines how much text we have already
# written so we know where to start
textheight=17 #how much we add each time we add a line of text
textstart=100 #where a block of text will start (y axis), this will be set in the code
myfile="ProMini" #file read in to be parsed
fontsize=12
imagewidth=250
imageheight=250
indent = 1

############################################## FUNCTIONS ############################################

#Writes plain text from the text section
def writeText(i,value,row):

  text = dwg.add(dwg.text(str(value), insert=(0,textstart),font_size=12, font_family='Montserrat', fill='black'))
  #print ("Printing " + str(value) + " at " + str(textstart))
  global previoustext
  previoustext = previoustext + textheight
  #end writeText

#Creates colored blocks and text for fields
def writeField(type,value,row,spot):
  #print("Type: " + str(type) + "  Value: " + value)
  if (type==0): #Pin name on board
    box0 = dwg.add(dwg.rect((rowwidth*spot+offset,row*rowheight), (width,height), 1, 1, stroke='black', opacity=0.3, fill='white'))
    text0 = dwg.add(dwg.text(str(value), insert=(spot*rowwidth+offset+indent,row*rowheight+height),font_size=fontsize, font_family='Montserrat',  fill='black'))
    #print("Box0, in white with " + value + " written in black")

  elif(type==1): #Power
    box1 = dwg.add(dwg.rect((rowwidth*spot+offset,row*rowheight), (width,height), 1, 1, stroke='red', opacity=0.8, fill='red'))
    text1 = dwg.add(dwg.text(str(value), insert=(spot*rowwidth+offset+indent,row*rowheight+height),font_size=fontsize, font_family='Montserrat',  fill='black'))
    #print("Box1, in red with " + value + " written in black")

  elif(type==2): #GND
    box2 = dwg.add(dwg.rect((rowwidth*spot+offset,row*rowheight), (width,height), 1, 1, stroke='black', opacity=0.9, fill='black'))
    text2 = dwg.add(dwg.text(str(value), insert=(spot*rowwidth+offset+indent,row*rowheight+height),font_size=fontsize, font_family='Montserrat',  fill='white'))
    #print("Box2, in black with " + value + " written in white")

  elif(type==3):#Control
    box3 = dwg.add(dwg.rect((rowwidth*spot+offset,row*rowheight), (width,height), 1, 1, stroke='yellow', opacity=0.7, fill='yellow'))
    text3 = dwg.add(dwg.text(str(value), insert=(spot*rowwidth+offset+indent,row*rowheight+height),font_size=fontsize, font_family='Montserrat',  fill='black'))
    #print("Box3 in red with " + value + " written in black")

  elif(type==4):#Arduino Pin number
    box4 = dwg.add(dwg.rect((rowwidth*spot+offset,row*rowheight), (width,height), 1, 1, stroke='green', opacity=0.3, fill='green'))
    text4 = dwg.add(dwg.text(str(value), insert=(spot*rowwidth+offset+indent,row*rowheight+height),font_size=fontsize, font_family='Montserrat',  fill='black'))
    #print("Box4 in green with " + value + " written in black")

  elif(type==5):#Port
    box5 = dwg.add(dwg.rect((rowwidth*spot+offset,row*rowheight), (width,height), 1, 1, stroke='blue', opacity=0.4, fill='blue'))
    text5 = dwg.add(dwg.text(str(value), insert=(spot*rowwidth+offset+indent,row*rowheight+height),font_size=fontsize, font_family='Montserrat',  fill='black'))
    #print("Box5 in blue with " + value + " written in black")

  elif(type==6):#Analog Pin
    box6 = dwg.add(dwg.rect((rowwidth*spot+offset,row*rowheight), (width,height), 1, 1, stroke='purple', opacity=0.4, fill='purple'))
    text6 = dwg.add(dwg.text(str(value), insert=(spot*rowwidth+offset+indent,row*rowheight+height),font_size=fontsize, font_family='Montserrat',  fill='black'))
    #print("Box6 in purple with " + value + " written in black")

  elif(type==7):#PWM
    box7 = dwg.add(dwg.rect((rowwidth*spot+offset,row*rowheight), (width,height), 1, 1, stroke='yellow', opacity=0.3, fill='yellow'))
    text7 = dwg.add(dwg.text(str(value), insert=(spot*rowwidth+offset+indent,row*rowheight+height),font_size=fontsize, font_family='Montserrat',  fill='black'))
    #print("Box7 in yellow with " + value + " written in black")

  elif(type==8):#Serial
    box8 = dwg.add(dwg.rect((rowwidth*spot+offset,row*rowheight), (width,height), 1, 1, stroke='grey', opacity=0.3, fill='grey'))
    text8 = dwg.add(dwg.text(str(value), insert=(spot*rowwidth+offset+indent,row*rowheight+height),font_size=fontsize, font_family='Montserrat',  fill='black'))
    #print("Box8 in grey with " + value + " written in black")

  elif(type==9):#External Interupt
    box9 = dwg.add(dwg.rect((rowwidth*spot+offset,row*rowheight), (width,height), 1, 1, stroke='purple', opacity=0.2, fill='purple'))
    text9 = dwg.add(dwg.text(str(value), insert=(spot*rowwidth+offset+indent,row*rowheight+height),font_size=fontsize, font_family='Montserrat',  fill='black'))
    #print("Box9 in purple with " + value + " written in black")

  elif(type==10):#Pin Chg Int
    box10 = dwg.add(dwg.rect((rowwidth*spot+offset,row*rowheight), (width,height), 1, 1, stroke='orange', opacity=0.5, fill='orange'))
    text10 = dwg.add(dwg.text(str(value), insert=(spot*rowwidth+offset+indent,row*rowheight+height),font_size=fontsize-3, font_family='Montserrat',  fill='black'))
    #print("Box10 in orange with " + value + " written in black")

  elif(type==11):#Misc
    box11 = dwg.add(dwg.rect((rowwidth*spot+offset,row*rowheight), (width,height), 1, 1, stroke='blue', opacity=0.1, fill='blue'))
    text11 = dwg.add(dwg.text(str(value), insert=(spot*rowwidth+offset+indent,row*rowheight+height),font_size=fontsize, font_family='Montserrat',  fill='black'))
    #print("Box11 in blue with " + value + " written in black")

  elif(type==12):#Misc2
    box12 = dwg.add(dwg.rect((rowwidth*spot+offset,row*rowheight), (width,height), 1, 1, stroke='blue', opacity=0.1, fill='blue'))
    text12 = dwg.add(dwg.text(str(value), insert=(spot*rowwidth+offset+indent,row*rowheight+height),font_size=fontsize, font_family='Montserrat',  fill='black'))
    #print("Box12 in blue with " + value + " written in black")
    #to add more, change elif statement, stroke color, fill color, text color, variable names (box and text) and print statement, also change 'fields' global variable
#end writeField


#adds images to end of document, currently not used as pngs don't work as well as I'd like and it is easier to just drag and drop the files I want into the final file.
def writeImages(i,value,row):
  global previoustext
  currentimage = "Images/" + value + ".png"
  if os.access(currentimage, os.R_OK):
    print "Adding " + currentimage
    image = dwg.add(dwg.image(href=("../" +  currentimage), insert=(i*imagewidth,textstart)))
  else:
    print "Could not find " + currentimage
#end writeImages


#open file with read access
myfile = raw_input("Enter file name minus .csv extension ()ex. ESP8266/Thing): ")
if os.access(myfile +".csv", os.R_OK):
  file = open(myfile +".csv","r")
  print "File opened"
else:
  print "File not found, please try again, there should be a comma deliminated csv file with the data in it.  See script for more details"
  time.sleep(10)
  os._exit(0)

#read in each line parse, and send each field to writeField
rawline="not empty"
dwg = svgwrite.Drawing(filename=str(myfile+".svg"), profile='tiny', size=(documentWidth,documentHeight))
while (rawline!=""):
  rawline  = file.readline()
  line = rawline.split(",") #Split into fields separated by ","
  row=row+1
  spot=0
  if (line[0] == "Left"):
    direction = "l"
    offset = documentWidth - rowwidth
    line[0] = ""
  if (line[0] == "Right"):
    direction = "r"
    offset = 0
    line[0] = ""
  if (line[0] == "Top"):
    direction = "r"
    offset = 0
    line[0] = ""
  if (line[0] == "Text"):
    offset = 0
    line[0] = ""
    direction = "text"
  if(line[0] == "Extras"):
    offset=0
    line[0]=""
    direction = "extras"
  if (line[0] == "EOF"): #if we are done
    dwg.save()
    break
  for i in range(0,fields): #go through total number of fields
      if(line[i]!="" and direction=='r'):
        writeField(i,line[i],row, spot)#call function to add that field to the svg file
        spot=spot+1 #move 'cursor' one spot to the right

      if(line[i]!="" and direction=='l'):
        writeField(i,line[i],row, spot)#call function to add that field to the svg file
        spot=spot-1 #move 'cursor' one spot to the left

      if (line[i]!="" and direction == "text"):
         textstart = row*rowheight+previoustext
         writeText(i,line[i],row)

      if (line[i]!="" and direction == "extras"):
        writeImages(i,line[i],row)
#end of while


print ("End of File, the output is located at " + myfile + ".svg")
file.close()
Another big thing was getting the data. I have to say, I did cheat a bit and get the basic ATmega328 and ATmega32U4 information from our Italian friend. But all that data has to be collected and there aren't many shortcuts. The plus side is most of the work only needs to be done once per microcontroller, and then copied and pasted to each board that uses it. Finally, each board ends up with a .csv file full of pin data. The Python script then reads the .csv and makes each row of data in colored boxes.
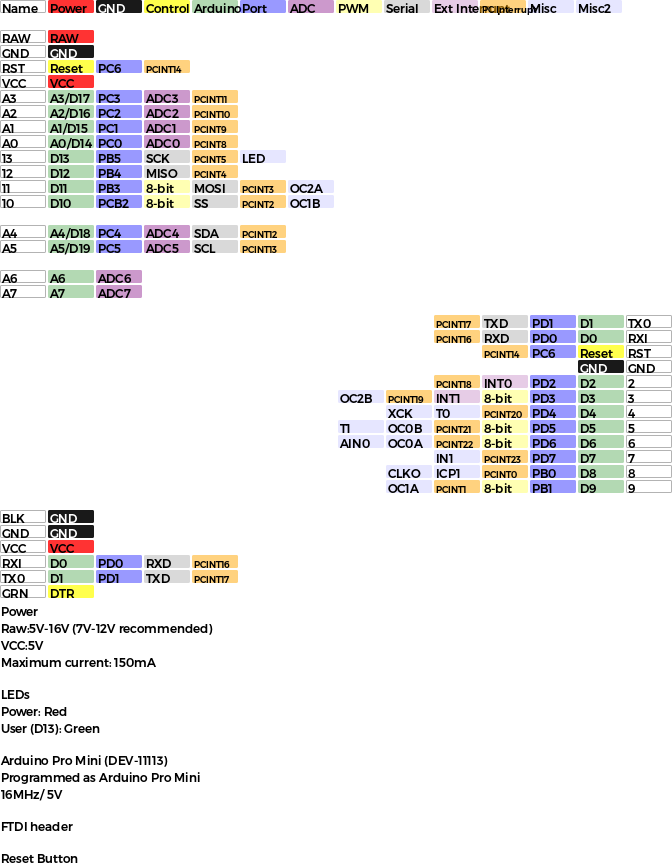
Output of the Python script for the Arduino Pro Mini
The next step involved the image we were going to use. I considered using a Fritzing image, but I didn't want to have to limit these to ones we had Fritzing diagrams for (or learn to make them myself). I considered using the image from Eagle, but that got messy and didn't look that great. I finally settled on the product images off the site. They don't scale as well as some formats like SVG, but they are there and readily available, and if need be should be fairly straight forward to take a picture for one that isn't.
At this point I have an SVG with all my boxes, and a .jpg with the image of my board. Time to open a new SVG and drag everything into place. The boxes are about the right size, so I pull them in, and resize the .jpg. I then line the boxes up and resize the whole thing a bit if I need to. The next step is basically design. For the most part the rest of the data is in the .csv file as well, it just shows up as text that I can move around. At this point there are tweaks that could probably be added into the Python script, but since each file is different it would take just as much time to add it to Python as to do it by hand.
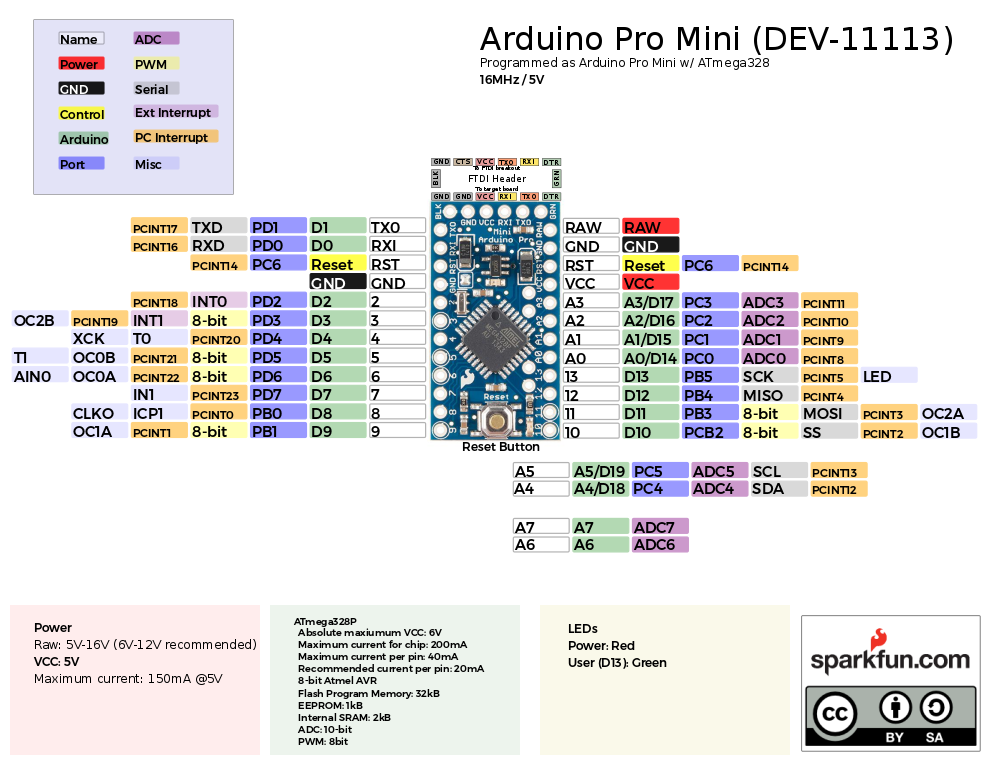
Final version of the Arduino Pro Mini
Once I've gotten everything onto the page we get to the most important step: printing it out and bugging the engineers. It is always a good idea to have someone double check your work, and who better to check it than the engineer who designed the board? This is especially useful for boards I haven't had a chance to use. Once everything has been tweaked and is ready to go I save a PDF version for the webpage and get the PDF and SVG files to our GitHub guru to add to the appropriate page. So all in all it took quite a few people from Italy, to the US, and all over SparkFun to bring you these graphical datasheets. Tomorrow's new products will actually have graphical datasheets available when they go live. I hope you enjoy them.
Boards that currently have graphical datasheets:
- SparkFun Redboard
- Arduino Pro Mini 3.3V
- Arduino Pro Mini 5V
- FreeSOC (Arduino Configuration)
- ESP8266 Thing
- Pro Micro 3.3V
- Pro Micro 5V
More coming with tomorrow's new products!- SamD21 Dev Board
- SamD21 Mini Board
Let me know what your favorite one is and your favorite feature. Currently I'm working on the more popular boards, but let me know if you have any requests.


These look fantastic! Thanks Michelle!
Great job! ;)
Hello PighiXXX, could you share the name of the program you use to create those awesome pin-out diagrams ?
Thank you, and thank for your inspiration.
Perhaps put the code on github? You might get all kinds of whizzy new features contributed. Maybe someone would even automate the merging of image data with the pin data and go straight to PDF or something like that? The CSV/... data sources would also be an extremely useful database to publish.
Code, files and CSVs are now on github... https://github.com/sparkfun/Graphical_Datasheets
Great job Michelle!
Any example of the CSV file please?
I went ahead and just uploaded everything to github. Keep in mind that the CSVs are not 100% correct. Once I had a laid out design I just edited text fields that were incorrect instead of editing the CSVs, re-running the script, and redesigning everything. https://github.com/sparkfun/Graphical_Datasheets
Great story!
Find here another series of pins maps for the LaunchPads and BoosterPacks from TI. They're drawn manually on a spreadsheet, so an automated solution would be highly useful!
http://embeddedcomputing.weebly.com/launchpads-and-boosterpacks-pins-maps.html
Thanks for sharing this @M-Short, I forked your repo and generated a Datasheet for the Photon. There is a pull request for you on your repo that also includes my version of the python script since I made some changes.
Thanks, I actually started a User Submitted folder on the Repo and added yours in there. Thanks again.
Code pro tip: Python has a great csv library. This automatically parses CSV files, and makes it easy to do things like put quotes around things like "VCC,V+" and not have the comma taken as a data field delimiter.
I will own those white "name" boxes for project purposes. They will be part of both planning and following lesson number one from Nate. They shall be blank, and receive (in pencil scribbles) the real use of the pins as used in the project. And that ref for what the pins could do will be just outside the plan being written... and debugged... and rewritten... and if it is ever final, there shall be a printable version, from a copy of the csv just for the use in that project.
I see some time with grbl 0.9 pinouts coming this weekend... and maybe sending a pull request.
A big thanks for open sourcing your work on this.
(edited to remove not-working html tags)
I really like these. I wonder if you guys can do some kind of print on demand thing and offer the ability to buy a colour printed version with a dev board?
Yay! these are in the wild! These look great!
Thanks! Wait until you see the new ones...