Have you ever received a package in the mail that looks like it might have fallen off the truck? Then probably ran over by that same truck a couple of times? Well I wanted to know just how handled packages get when traveling to their destinations. With some SparkFun parts inside 3 identical boxes sent out through 3 different mail carriers all to the same destination, we calculated some data about their journeys.
Most packages arrive at my front door looking just as I expect. This was until I remodeled my kitchen and I had to order the same sink 3 times because they kept arriving with huge cracks through them. Through this experience, I wanted to know what a package goes through on its journey to its destination. How beat up does it get? How often is it dropped? How much force is pushed on it while traveling on a truck?
We came up with a little experiment using SparkFun parts to get some hard data. I asked Mariah to build a prototype that could read acceleration data for any movements or drops, and any force data the boxes might encounter when being stacked in a truck or facility. We created 3 identical boxes to use different delivery companies and then compare the sets of data. They traveled about 1000 miles to our Design Manager Blake who works remotely in northern Idaho and then the 1000 miles back to SparkFun in Colorado.
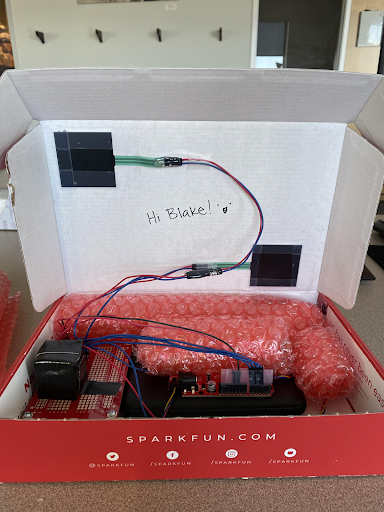
Each of the trackers comes equipped with 4 force sensitive resistors (FSRs), a qwiic micro 6-axis accelerometer, a qwiic redboard, an openlog with a 1GB SD card, a 10Ah battery pack, a solderable breadboard, and various jelly bean parts needed to make it all work!
There’s one part included, a super bright blue LED, that doesn’t actually add anything to the data collection circuit; this is only added to increase the current draw of the system so that it doesn’t fall under the minimum threshold of the battery pack, which is 60mA. Without this LED, the circuit draws around 35mA, and is boosted to around 80mA with it. This keeps the battery pack from entering stand-by mode and allows for the full charge to be used as it’s traveling.
Now, let’s do a quick run-down of the type of data we’re collecting on our openlog! The accelerometer will record values from 3 axes: the X, Y, and Z. This will tell us how much the package is jostled around left to right, front to back, and up and down. Initially we’d planned to include gyroscopic data as well, which would track the rotation of the package about those axes, but ran into some trouble with it that couldn’t be sorted out within the timeframe we were shooting for. We’ll just have to save that for version two!
In addition to the accelerometer data, we also have force data from our 4 FSRs; these are placed catty-corner from one another on both the top and bottom of the box, so that we can get a sense of the full force exerted over the surface. The FSRs are able to record values and then convert those into units that we recognize, such as grams or pounds. Since we didn’t expect such a small package to be put under a ton of pressure, we went with grams as our unit of choice to get a more granular (or maybe gram-ular) view of the force data.
Check out the full list of parts below:!
We sent these 3 identical boxes out to our Design Manager Blake in Idaho about 1000 miles away. Now we knew that sending a box full of wired up electronics might raise some red flags, but we thought that just might create some added suspense. We named the boxes based on the shipment companies we used: Brown, Blue, and Orange.
They all arrived within a few days and Blake was able to pull the data from the microSD and give us an update. The Blue and Brown boxes arrived with a dead battery and plenty of data. However the Orange box had multiple boards and the battery disconnected inside once it arrived. Blake recharged the batteries, reconnected the Orange box, and sent them back over to us in Colorado.
Mariah and I received the boxes safe-and-sound… sort of. Blue and Orange had dead batteries and plenty of data, but Brown was delayed a couple of days and arrived with its electronics pretty battered. Like someone took a handful of the wires and pulled. Regardless we got our results from the data that was gathered and here it is!
After getting all of the data off of each respective SD card, it looks a little something like this:
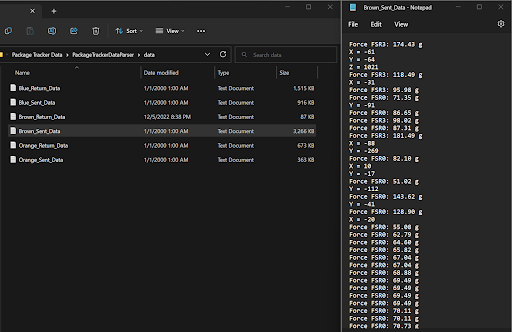
As you can see, we got a ton of force data for our FSR0 (this is the top left sensor on the box); this is largely due to the placement of our little LED tent providing a much more solid surface to press against than the ESD bubble wrap around the rest of the box. In another iteration we’d likely duplicate this effect on the other sensors, or try to prevent it from being concentrated on a single spot.
Now, we can toss all of our data into a Processing sketch we put together to parse out each data type, and save those as separate files (this doesn’t run anything in the draw function, so it’s not much to look at, but it works!).
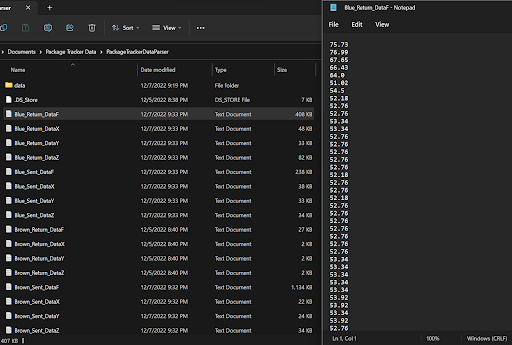
So here you can see that we have all of the raw force values for our blue box’s return data (the files for the other boxes look similar). From this, our colleague Lauren was able to create some visualizations of our values! Let’s take a look:
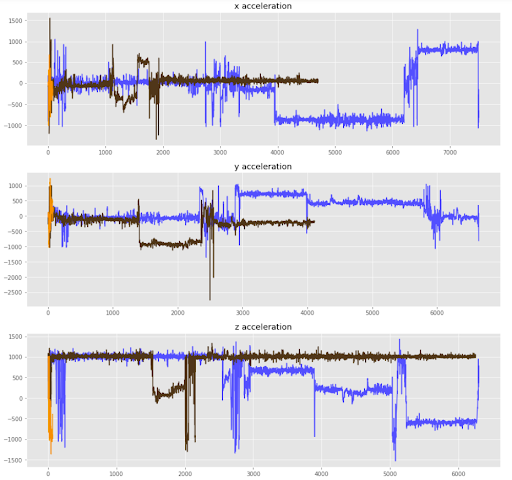
Above is our accelerometer data for the trip out to Blake; you can see in these charts that our orange box has significantly fewer plotted points than our brown and blue. This is because that box arrived unplugged (and with a fully charged battery, so we can assume this likely happened pretty early on in its journey). On the flip side, the brown box returned back to us unplugged, so our return data for brown is similarly cut off:
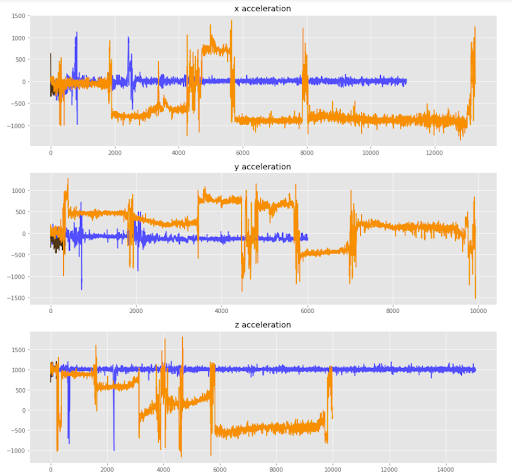
Now, unfortunately we did not take any timestamp data, nor concurrent values across all three axes in this iteration; this limits what we can specifically determine about the boxes’ trip and how they moved around. We can look at the sheer number of recordings from our accelerometer, which may give us some insight into which carrier had the most movement overall, but won’t give us a detailed account of the type of movement that occurred. These are all considerations for version two!
Lastly, let’s check out our overall force data for each box over both trips:
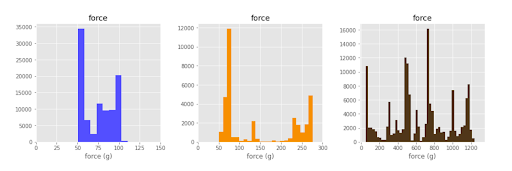
Here, again, we can tell that our orange and brown boxes did not record for the entirety of both trips by the fact that our scale for the number of recordings is quite different between those two and our blue box, which we know stayed running to and from Blake. Interestingly, however, our blue box did have the least variation of force out of the three, with brown having both the greatest range and highest recorded value of 1200g (which is about 2.5 lbs).
Well now we just want to do this experiment again but with even more electronics to get more extensive data! What would you have done differently and what do you think we should add to version 2?
You can check out our video on this project here!


That was great!!! For the next version, what about including a simple light sensor so you can see if someone opens the box before it gets delivered?
For the 2nd edition, I suggest encasing everything in a metal box (faraday cage) with a lock. This will prevent carriers from (A) detecting anything is active in the box, (B) opening the electronics up, and (C) damaging the unit.
I applaud the idea of using a lower power unit with alkaline batteries. Lithium batteries will definitely raise eyebrows and may violate some transportation laws. Better safe than sorry.
And now for my second "relevant" story: Back in 1980, when I was finally getting my Engineering degree, one of the companies I interviewed with for a job was Tektronics, a company that makes "high end" oscilloscopes and other instruments. Part of the interview process included a tour of their facility, and included in that we happened to visit the group that designed the custom packaging for shipping their sensitive instruments to customers. I might should point out that some of those "gadgets" cost more than a new car, and had some pretty incredible precision. Anyway, every instrument in their catalog had it's own custom packaging, and to test that packaging, the standard procedure was to take one of the first of that instrument built, print out all the calibration data, and put it into the packaging. It was then shipped around to all of their various "field offices" (if I recall correctly, I think the number was 14), using as many different carriers as possible, with it ending up back in the main plant in Beaverton, OR. The instrument was then re-tested, and if it was still in calibration, the packaging passed the test!
Finally, a few minutes to type in the first of my "relevant" stories: About 10 years ago, I'd ordered a bunch of parts from Digi-Key for a couple of "projects" i was working on at the time. The package arrived several days later than the original delivery estimate, and it looked like it had been through the proverbial train wreck. I'd been watching it's progress through brown's tracking website, and from that knew that there was good reason for it being late and looking like it had been through a train wreck: it HAD been through an actual train wreck! (I regret not having thought to take any pictures of the box.) I went through the contents carefully, and all was there, and all the parts were in good shape (and later proved to be in working order), but a few were packaged in individual cardboard boxes that themselves were mashed. I wan't too worried about the boxes, though, as they were destined for the recycle bin anyway.
I'm a tad bit surprised that you didn't use the SparkFun OpenLog Artemis or SparkFun OpenLog Artemis (without IMU) (though with the latter you'd have to have an extermal accellerometer). With a bit of tinkering, you should be able to get the average current down to about 14 or so mA (disabling LEDs, going into "sleep" mode, etc.) which would mean that you could power it for at least 3 days with 3 AA cells going into the 5V connection. It seems to me that powering it with alkaline batteries rather than LiPos would cause fewer "raised eyebrows" with the "shipping wizzards. ;-)
BTW, I have two "relevant" stories to relate, but don't have time today to type them up. Hopefully tomorrow!
Good morning - that was a very interesting experiment. I too have often wondered of the tortures some packages I receive went through. One question: In the narrative and video it is mentioned that in at least one instance cables were disconnected though you do not mention if it was clear that the Sparkfun package was actually opened by the shipper, and if it was, was there a label or other notation explaining that the package was opened.
I have receive one or two packages where the USPS opened a package and there was an obvious label on the package explaining that the contents were inspected by the USPS.
I did a similar project working at BU back in 2005 with motes connected to an accelerometer. I sent a package through the US Postal service to myself. Kinda fun to see the bumps.