Enginursday: Solving Real-World Problems with Data.SparkFun.com
Learn how data.sparkfun.com can help you not just collect data, but also use that data to make hypothesizes, see trends, and make adjustments to a variety of systems.

One year ago, around this time, I began a new hobby: building and maintaining aquaponic systems. You may recall some of my previous aquaponic posts:
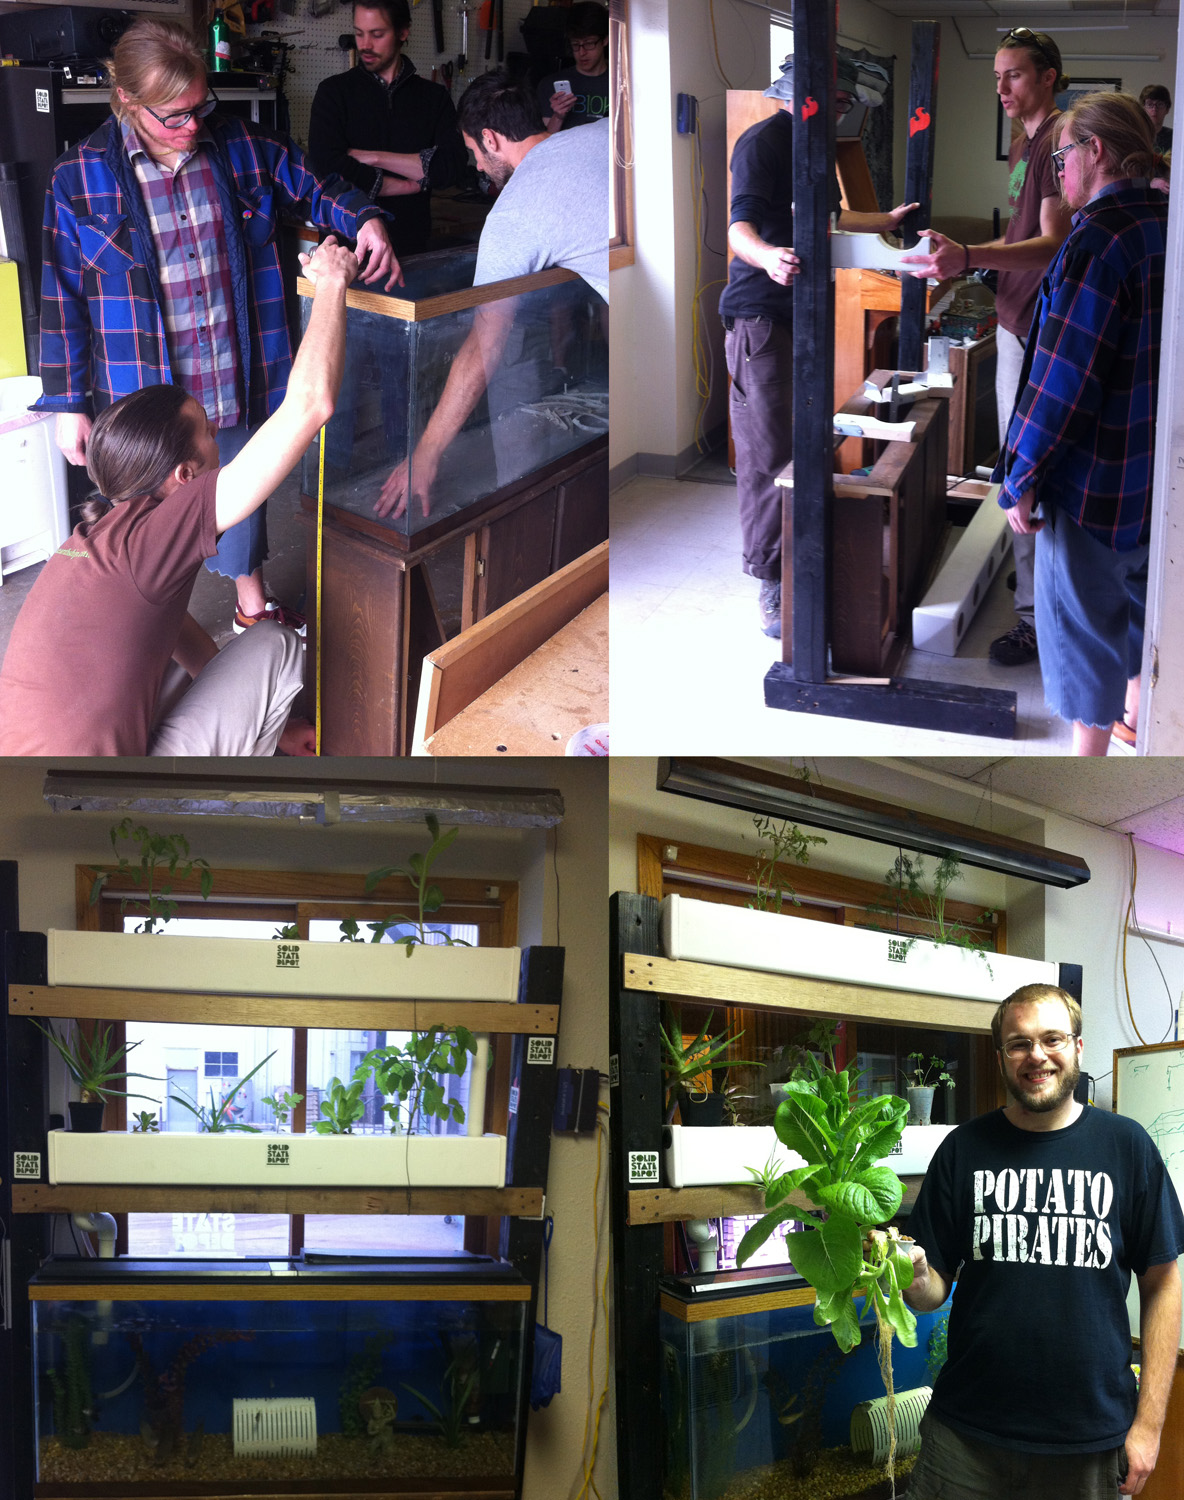
It has been a non-stop adventure, and everyday brings new challenges and rewards. It has also been a great opportunity to blend my love for electronics with my love for the aquatic. Aside from my two home systems, I also helped organize a group build project at my local hackerspace, Solid State Depot. The idea was to give those who had never built an aquaponic system a chance to see what the process was like. My intent was for this system to become both a teaching tool as well as adding a little decor to the hackerspace.
Over the course of three weekends, myself and many others from both the hackerspace community and the aquaponics community came to contribute to the group build. The system has been up and running since May, 2014.
The Problem
Unlike my systems at home, this one did not receive my full attention. I can be absent from the space for an entire week, at times. As the peak of summer drew near, I started to notice that the water temperature fluctuated more than fish tend to like and were much higher than the optimal aquarium temperature, even for tropical fish. I knew if I didn't do something about this soon, it could jeopardize my fish's health. It was time to find an embedded solution to both monitor and control the water temperature.
Collecting the Data
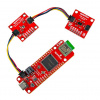
About the time I discovered this problem was the same time SparkFun's free data service, data.sparkfun.com aka Phant, was launched. If you haven't checked it out yet, it's a great way to get started with data collection and manipulation. Using our Pushing Data to Data.SparkFun.com tutorial, I connected a DS18B20 temperature sensor and a waterproof DS18B20 temperature sensor to a Raspberry Pi B+.The waterproof probe was placed in the tank, and the standard DS18B20 sensor was attached to the side of the tank stand to monitor the room temperature, with both temperatures being broadcast to data.sparkfun.com via the hackerspace network.
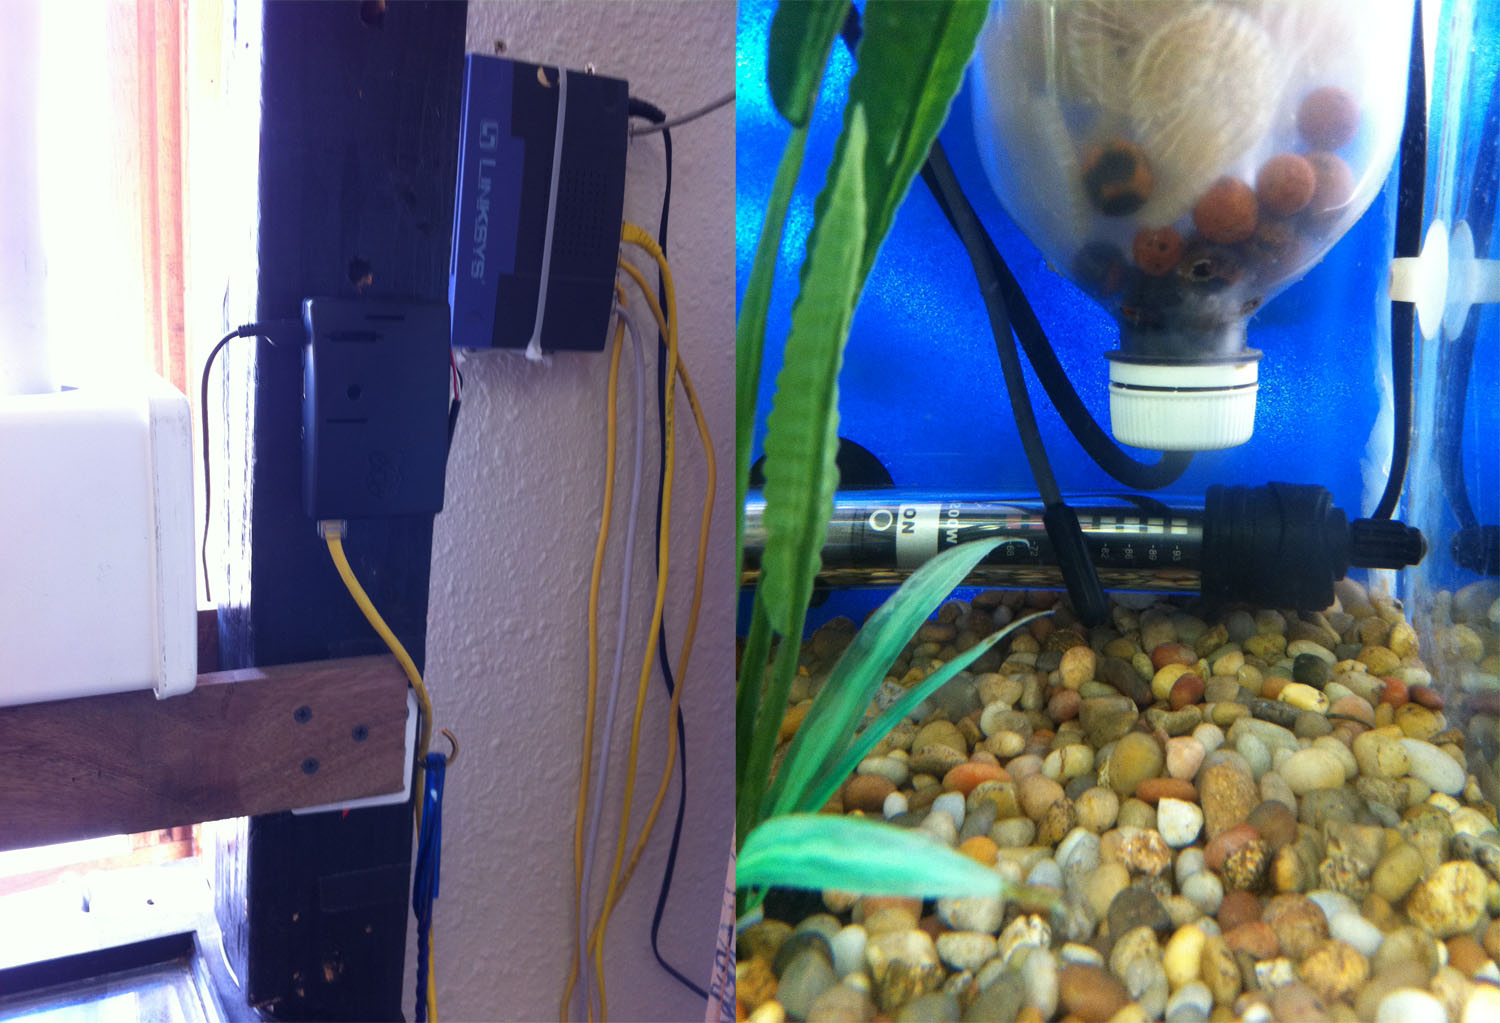
The Raspberry Pi B+ enclosed and mounted (left). The probe in the water (right).
The raw data stream can be found here, and here is the python script I used:
import os
import os.path
import glob
import time
from datetime import datetime
import httplib, urllib#http and url libs used for HTTP POSTs
import socket# socket used to get host name/IP
#################
## Phant Stuff ##
#################
server = "data.sparkfun.com" # base URL of your feed
publicKey = "yourpublickey" # public key, everyone can see this
privateKey = "yourprivatekey"# private key, only you should know
fields = ["date", "time", "temp"]#Your feed's data fields

#These lines connect to the DS18B20 Temp Sensor
os.system('modprobe w1-gpio')
os.system('modprobe w1-therm')

device_file = '/sys/bus/w1/devices/28-0000052688c3/w1_slave'#use your devices address(es)
device_file2 = '/sys/bus/w1/devices/28-000005313015/w1_slave'

###########
#Functions#
###########
def read_temp_raw(temp_choice):
    if temp_choice == 0:
        f = open(device_file, 'r')
    else:
        f = open(device_file2, 'r')
    lines = f.readlines()
    f.close()
    return lines

def read_temp(read_choice):
    if read_choice == 0:
         lines = read_temp_raw(0)
    else:
         lines = read_temp_raw(1)

    while lines[0].strip()[-3:] != 'YES':
        time.sleep(0.2)
        lines = read_temp_raw()
    equals_pos = lines[1].find('t=')
    if equals_pos != -1:
        temp_string = lines[1][equals_pos+2:]
        temp_c = float(temp_string) / 1000.0
        temp_f = temp_c * 9.0 / 5.0 + 32.0
        return "%.2f" %  temp_f


def post_data():
    temp0 = read_temp(0)
    temp1 = read_temp(1)
    print("Sending an update!")
    # Our first job is to create the data set. Should turn into
    # something like "light=1234&switch=0&name=raspberrypi"
    data = {} # Create empty set, then fill in with our three fields:
    # Field 0, light, gets the local time:
    data[fields[0]] = temp0
    # Field 1, switch, gets the switch status:
    data[fields[1]] = temp1
    # Next, we need to encode that data into a url format:
    params = urllib.urlencode(data)
    # Now we need to set up our headers:
    headers = {} # start with an empty set
    # These are static, should be there every time:
    headers["Content-Type"] = "application/x-www-form-urlencoded"
    headers["Connection"] = "close"
    headers["Content-Length"] = len(params) # length of data
    headers["Phant-Private-Key"] = privateKey # private key header
    # Now we initiate a connection, and post the data
    c = httplib.HTTPConnection(server)
    # Here's the magic, our reqeust format is POST, we want
    # to send the data to data.sparkfun.com/input/PUBLIC_KEY.txt
    # and include both our data (params) and headers
    c.request("POST", "/input/" + publicKey + ".txt", params, headers)
    r = c.getresponse() # Get the server's response and print print r.status, r.reason


while True:
    print("H2O temp = " + read_temp(0) + "F")
    print("Room temp = " + read_temp(1) + "F")
    post_data()
    time.sleep(600)
Visualizing the Data
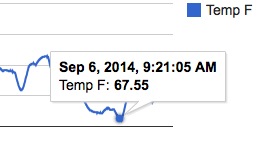
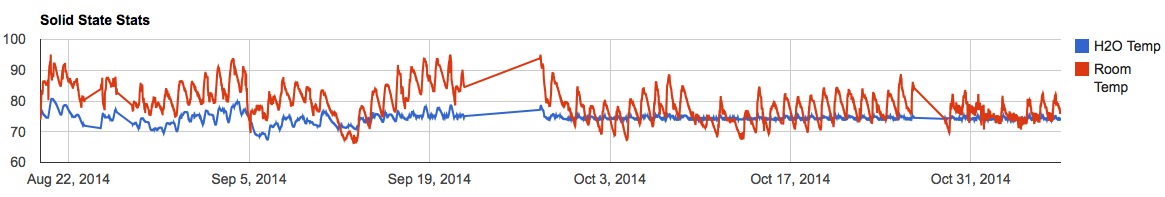
Using the documentation found on phant.io, I was able to set up some HTML pages on my Wordpress site that would dish up some Google charts containing water and room temperatures. The data revealed very unstable temperatures, just as I had suspected.
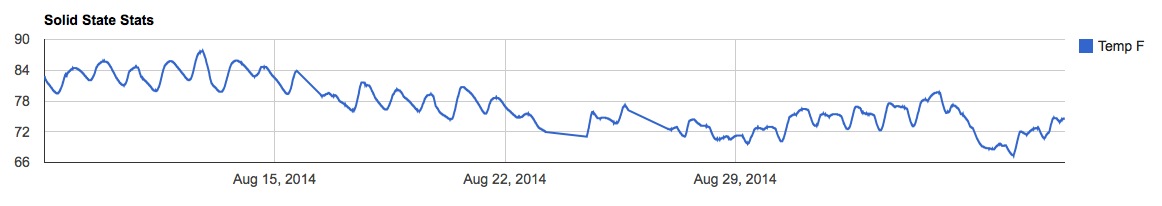
Water temperature in °F, from August 08, 2014 - Sept. 08, 2014.
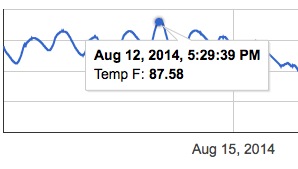
Most tropical fish enjoy temperatures between 75-80°F, however, my tank was fluctuating from as high as 87°F to as low as 67°F.
One of the main causes of the fluctuation in water temperature was the fluctuating room temperature in the hackerspace, which can swing a lot in one day. Adding in the room temperature to the graph made that even more apparent.
Though the temperature outside was starting to cool down, the hackerspace is south-facing and retains a lot of afternoon heat. That coupled with the fact that fall was right around the corner, I knew I needed a better way to control the tank temperature and fast.
Finding a Solution
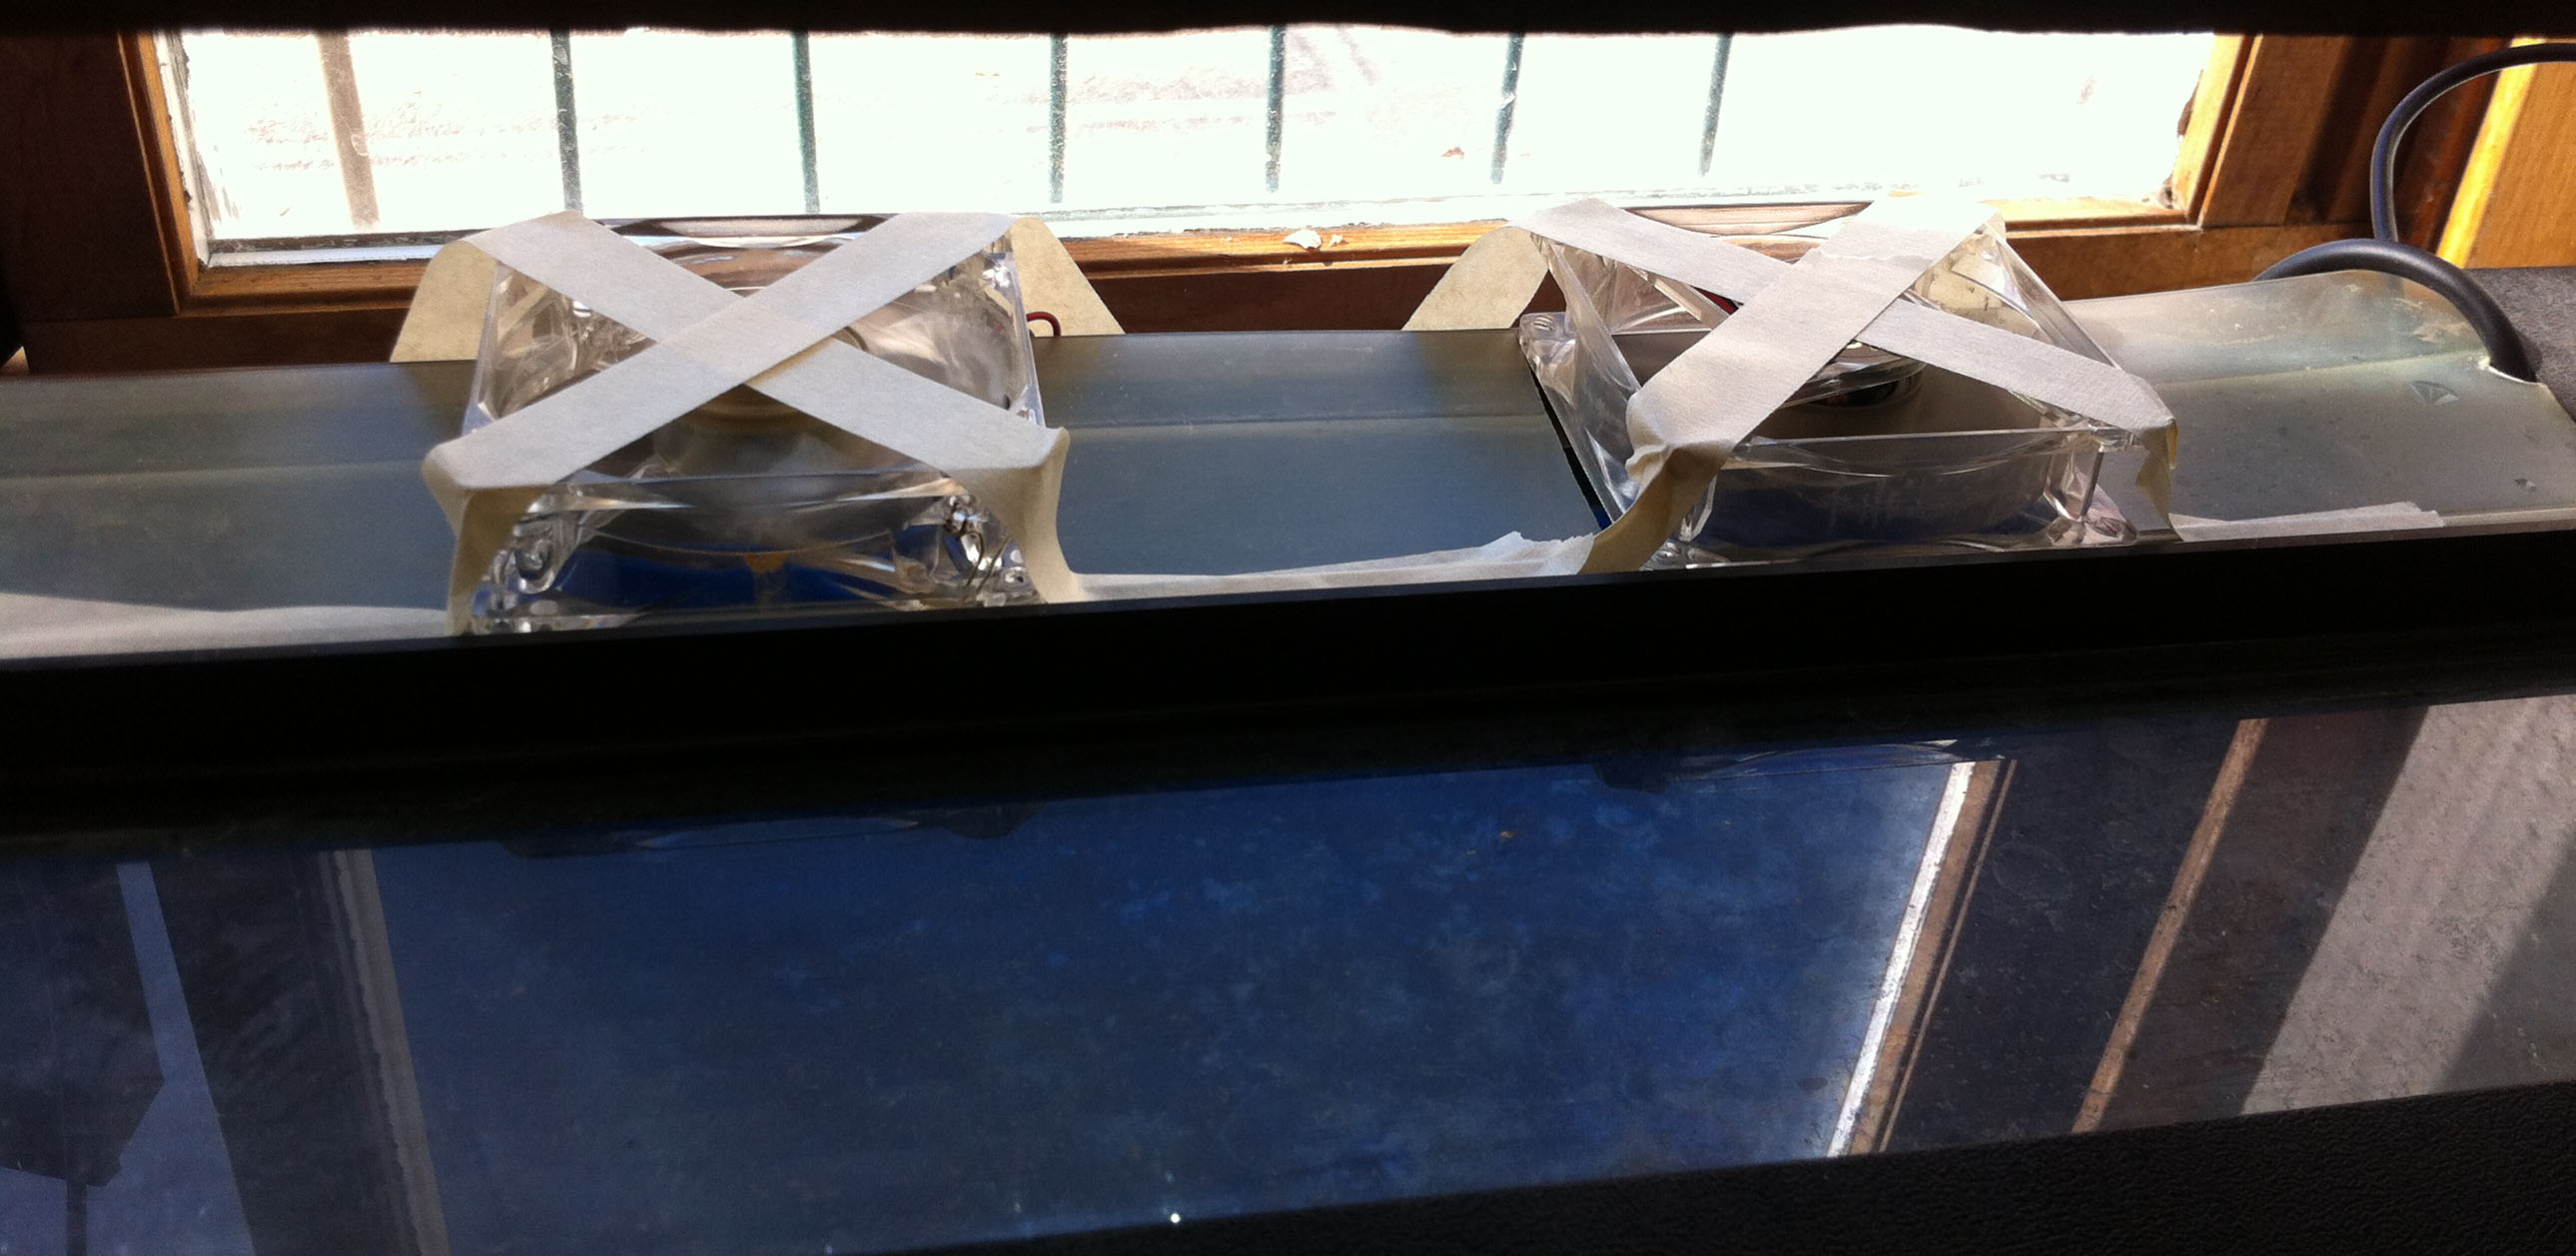
To combat the heat, I attached two computer fans on the backside of the fish tank, first with tape for testing, then affixed more permanently.
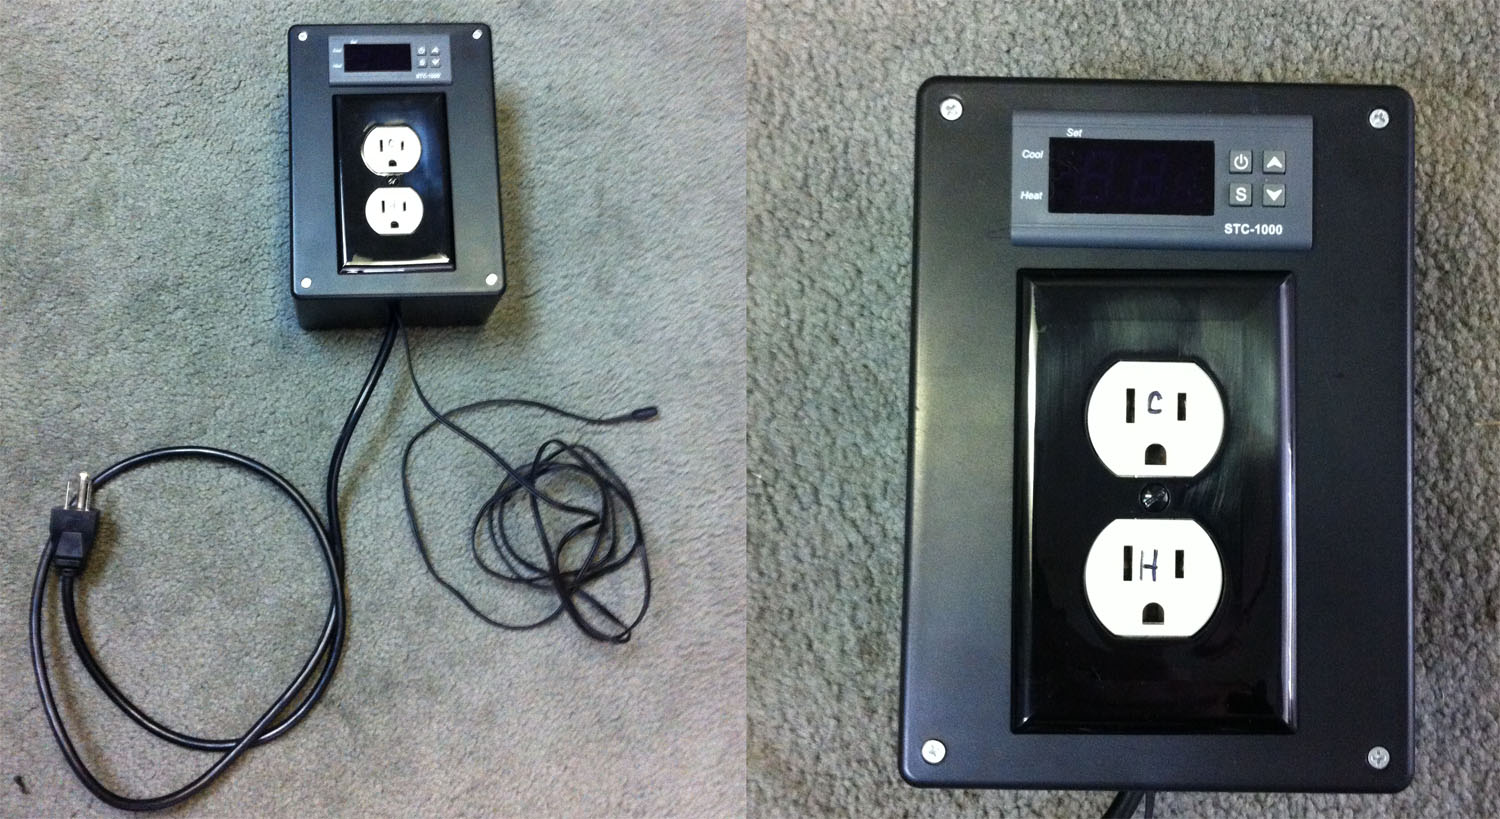
At first, I left them plugged in 24/7. However, that led to the water getting too cold at night. Leaving both the heater and the fans plugged in seemed wasteful, so I sought another solution. I remembered a fellow SparkFunion using PID controllers. After asking around and doing some research, I settled on an SCT-1000 PID from Amazon and followed this tutorial to create my own PID temperature controller. The main appeal of this particular PID was the fact that it had both a heating and a cooling relay, perfect for my situation. Each outlet was labeled accordingly, 'H' for heating and 'C' for cooling.
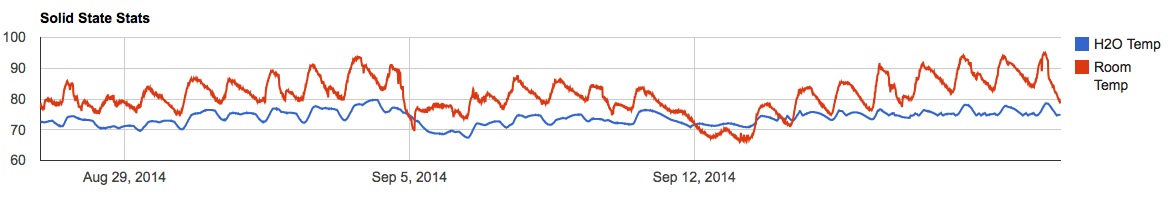
With the PID setup, it was time to wait and see if it would make a difference. The data told no lies. The water temperature had stabilized!
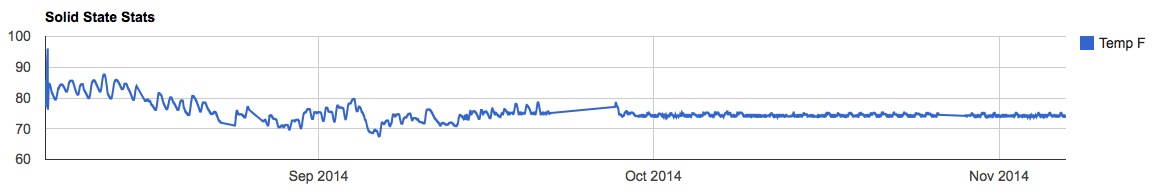
Water temperature before and after the introduction of the PID controller.
As expected, the water temp stayed within the 73-76°F no matter what the room temperature was. My solution had been found.
The flat lines are periods when the RasPi was offline.
The tank temperature has been stable since, and the quality of life for my fish has improved. You can see the live graph here.
Going Further
Now that the foundation has been laid for getting data to data.sparkfun.com and visualizing that data, finding new parameters to measure is just a few lines of code away. I'm currently working on getting my home systems up on Phant, monitoring temp and pH. From there, I hope to create an all-in-one, open-source aquarium monitoring solution, combing the time-lapse I showed in my previous posts with the data monitoring. I would also like to have the Raspberry Pi handle the PID control as well, having everything in one device. When that day comes, I'll be sure to share it with everyone who loves this hobby as much as I do. Thanks for reading!


Not to be weird, but I found the last two graphs incredibly satisfying. So stable...
Not weird at all. I sit there and stare at my graphs all day long even though they hardly change in a 24 hour period.
I don't believe this is a PID controller, but rather a Hysteresis controller, correct?
Can you elaborate a little on how you created the charts for your Wordpress site? I've followed all your posts on your aquaponics projects. I'm working on similar projects for my daughter and my brother. I was planning to write something in python that would work on a local server but the Wordpress/Google Charts solution seems like it would be WAY simpler.
This tutorial on phant.io should get you started. I'll be writing up a tutorial on how to take that one step further by manipulating the time frames and adding multiple graphs to a single page. I'll add an update here once it's finished.
What an awesome update! Your work continues to inspire me, Joel.
Thanks Roberto. I'm glad my projects are a source of inspiration for you.
Cool use of a PID controller! If anyone is interested, there is an Arduino PID library, as well as an open-source PID controller that uses it. The controller doesn't have many of the advanced features of a commercial controller, but it's got all the basics, including auto-tuning.
(I work for a company that manufactures PID controllers, so this post grabbed my attention.)
This is a GREAT article, thank you for sharing!
Also, learning about SparkFun's data service is very helpful, and that PID is terrific! I wonder if I could build one...
Regarding the graphs, it would be interesting to get one of the local weather on those days overlaid on those graphs, at least the pre-PID ones. At a minimum, it would help your hacker space figure out how to save some energy and figure out how poorly the insulation is, since undoubtedly the internal air temperature had been modified using heating/cooling - which also corresponds to the highest energy usage costs of each day.
Kudos for an excellent project and write-up!
Cheers, Robert~
Thank you for reading! I should find some local weather to throw in there. I could just pull in the temperature from the Wimp Weather station. And adding the room temp was part inspired by the fact that we knew our space was hot, we just didn't know how hot. That the graph we were finally able to see when the peak temperatures occurred. By the time we had a plan in place to get a hole cut in the roof and make our own passive cooling system, the temperature had cooled down enough to put it off until next summer.
I really need to pay attention to my Meetup emails. I'm on your group, but have yet been able to make a meeting. Now that winter is here (with a vengeance), I'd like to set up a system in my house and with this added Geekery thrown in, how can I resist?
You're always welcome to stop by our Tuesday open house, every Tuesday from 7-10. There's plenty of geekery to be had there.