Crowdsourcing Algorithms
Looking for information in the noise: a contest to crowdsource a better algorithm for accelerometer data.


Used with permission from the awe-inspiring TBD Catalog
With the invention of triple-axis accelerometers and open source libraries, it’s becoming pretty easy to gather data. I can generate a tremendous amount of data using an Arduino and an OpenLog to log it. The problem is always the same: What do you do with all that data?
So here’s a real world example: A few years ago I built a Speed Bag Counter. For those who don’t frequent a boxing gym, the speed bag is the teardrop-shaped bag that boxers hit in quick unison to strengthen their shoulders and develop their hand-eye coordination. A standard round is three minutes, and because of the speed at which the bag bounces it’s pretty much impossible to keep count. I decided to build a counter so I could keep track of my improvement over time. Just hook up an accelerometer and a display to an Arduino, and you’re good to go, right? As they say, the devil’s in the algorithm.
Accelerometer data is messy
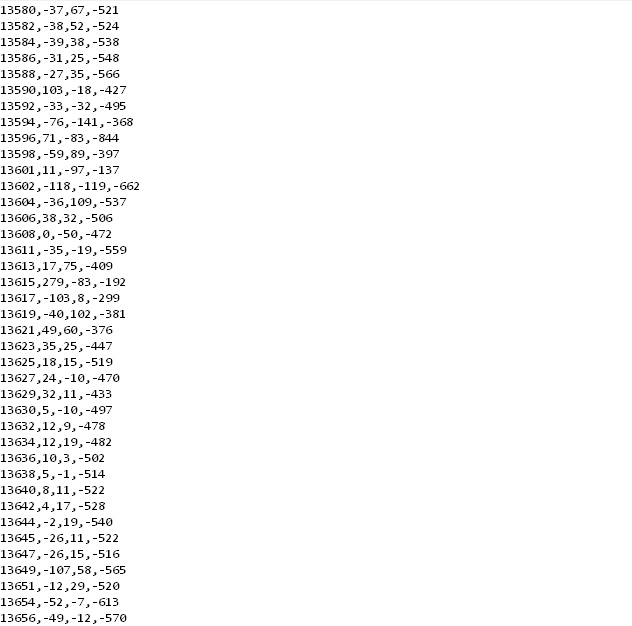
Pictured above is one of the datasets I captured when I was trying to validate the system. Real-world data is noisy.
But wait, we should be able to see periodicity and other key traits, right?

Unfortunately, even with logging at 500Hz, the data is not self-explanatory. With this data I did my best to try to create a system that could count hits.
/*
 BeatBag - A Speed Bag Counter
 Nathan Seidle
 SparkFun Electronics
 2/23/2013

 License: This code is public domain but you buy me a beer if you use this and we meet someday (Beerware license).

 BeatBag is a speed bag counter that uses an accelerometer to counts the number hits.
 It's easily installed ontop of speed bag platform only needing an accelerometer attached to the top of platform.
 You don't have to alter the hitting surface or change out the swivel.

 I combine X/Y/Z into one vector and look only at the magnitude.
 I use a fourth order filter to see the impacts (accelerometer peaks) from the speed bag. It works pretty well.
 It's very reproducible but I'm not entirely sure how accurate it is. I can detect both bag hits (forward/backward) then
 I divide by two to get the number displayed to the user.

 I arrived at the peak detection algorithm using video and raw data recordings. After a fourth filtering I could glean the
 peaks. There is probably a much better way to do the math on the peak detection but it's not one of my strength.

 Hardware setup:
 5V from wall supply goes into barrel jack on Redboard. Trace cut to diode.
 RedBoard barel jack is wired to power switch then to Vin diode
 Display gets power from Vin and data from I2C pins
 Vcc/Gnd from RedBoard goes into Bread Board Power supply that supplies 3.3V to accelerometer. Future
 versions should get power from 3.3V rail on RedBoard.

 MMA8452 Breakout ------------ Arduino
 3.3V --------------------- 3.3V
 SDA(yellow) -------^^(330)^^------- A4
 SCL(blue) -------^^(330)^^------- A5
 GND ---------------------- GND
 The MMA8452 is 3.3V so we recommend using 330 or 1k resistors between a 5V Arduino and the MMA8452 breakout.
 The MMA8452 has built in pull-up resistors for I2C so you do not need additional pull-ups.

 3/2/2013 - Got data from Hugo and myself, 3 rounds, on 2g setting. Very noisy but mostly worked

 12/19/15 - Segment burned out. Power down display after 10 minutes of non-use.
 Use I2C, see if we can avoid the 'multiply by 10' display problem.

 1/23/16 - Accel not reliable. Because the display is now also on the I2C the pull-up resistors on the accel where
 not enough. Swapped out to new accel. Added 100 ohm inline resistors to accel and 4.7k resistors from SDA/SCL to 5V.
 Reinforced connection from accel to RedBoard.

 */

#include <avr/wdt.h> //We need watch dog for this program

#include <Wire.h> // Used for I2C

#define DISPLAY_ADDRESS 0x71 //I2C address of OpenSegment display

int hitCounter = 0; //Keeps track of the number of hits

const int resetButton = 6; //Button that resets the display and counter
const int LED = 13; //Status LED on D3

long lastPrint; //Used for printing updates every second

boolean displayOn; //Used to track if display is turned off or not

//Used in the new algorithm
float lastMagnitude = 0;
float lastFirstPass = 0;
float lastSecondPass = 0;
float lastThirdPass = 0;
long lastHitTime = 0;
int secondsCounter = 0;

//This was found using a spreadsheet to view raw data and filter it
const float WEIGHT = 0.9;

//This was found using a spreadsheet to view raw data and filter it
const int MIN_MAGNITUDE_THRESHOLD = 1000; //350 is good

//This is the minimum number of ms between possible hits
//We use this to filter out peaks that are too close together
const int MIN_TIME_BETWEEN_HITS = 90; //100 works well

//This is the number of miliseconds before we turn off the display
long TIME_TO_DISPLAY_OFF = 60L * 1000L * 5L; //5 minutes of no use

int DEFAULT_BRIGHTNESS = 50; //50% brightness to avoid burning out segments after 3 years of use

unsigned long currentTime; //Used for millis checking

void setup()
{
  wdt_reset(); //Pet the dog
  wdt_disable(); //We don't want the watchdog during init

  pinMode(resetButton, INPUT_PULLUP);
  pinMode(LED, OUTPUT);

  //By default .begin() will set I2C SCL to Standard Speed mode of 100kHz
  Wire.setClock(400000); //Optional - set I2C SCL to High Speed Mode of 400kHz
  Wire.begin(); //Join the bus as a master

  Serial.begin(115200);
  Serial.println("Speed Bag Counter");

  initDisplay();

  clearDisplay();
  Wire.beginTransmission(DISPLAY_ADDRESS);
  Wire.print("Accl"); //Display an error until accel comes online
  Wire.endTransmission();

  while(!initMMA8452()) //Test and intialize the MMA8452
    ; //Do nothing

  clearDisplay();
  Wire.beginTransmission(DISPLAY_ADDRESS);
  Wire.print("0000");
  Wire.endTransmission();

  lastPrint = millis();
  lastHitTime = millis();

  wdt_enable(WDTO_250MS); //Unleash the beast
}

void loop()
{
  wdt_reset(); //Pet the dog

  currentTime = millis();
  if ((unsigned long)(currentTime - lastPrint) >= 1000)
  {
    if (digitalRead(LED) == LOW)
      digitalWrite(LED, HIGH);
    else
      digitalWrite(LED, LOW);

    lastPrint = millis();
  }

  //See if we should power down the display due to inactivity
  if (displayOn == true)
  {
    currentTime = millis();
    if ((unsigned long)(currentTime - lastHitTime) >= TIME_TO_DISPLAY_OFF)
    {
      Serial.println("Power save");

      hitCounter = 0; //Reset the count

      clearDisplay(); //Clear to save power
      displayOn = false;
    }
  }

  //Check the accelerometer
  float currentMagnitude = getAccelData();

  //Send this value through four (yes four) high pass filters
  float firstPass = currentMagnitude - (lastMagnitude * WEIGHT) - (currentMagnitude * (1 - WEIGHT));
  lastMagnitude = currentMagnitude; //Remember this for next time around

  float secondPass = firstPass - (lastFirstPass * WEIGHT) - (firstPass * (1 - WEIGHT));
  lastFirstPass = firstPass; //Remember this for next time around

  float thirdPass = secondPass - (lastSecondPass * WEIGHT) - (secondPass * (1 - WEIGHT));
  lastSecondPass = secondPass; //Remember this for next time around

  float fourthPass = thirdPass - (lastThirdPass * WEIGHT) - (thirdPass * (1 - WEIGHT));
  lastThirdPass = thirdPass; //Remember this for next time around
  //End high pass filtering

  fourthPass = abs(fourthPass); //Get the absolute value of this heavily filtered value

  //See if this magnitude is large enough to care
  if (fourthPass > MIN_MAGNITUDE_THRESHOLD)
  {
    //We have a potential hit!

    currentTime = millis();
    if ((unsigned long)(currentTime - lastHitTime) >= MIN_TIME_BETWEEN_HITS)
    {
      //We really do have a hit!
      hitCounter++;

      lastHitTime = millis();

      //Serial.print("Hit: ");
      //Serial.println(hitCounter);

      if (displayOn == false) displayOn = true;

      printHits(); //Updates the display
    }
  }


  //Check if we need to reset the counter and display
  if (digitalRead(resetButton) == LOW)
  {
    //This breaks the file up so we can see where we hit the reset button
    Serial.println();
    Serial.println();
    Serial.println("Reset!");
    Serial.println();
    Serial.println();

    hitCounter = 0;

    resetDisplay(); //Forces cursor to beginning of display
    printHits(); //Updates the display

    while (digitalRead(resetButton) == LOW) wdt_reset(); //Pet the dog while we wait for you to remove finger

    //Do nothing for 250ms after you press the button, a sort of debounce
    for (int x = 0 ; x < 25 ; x++)
    {
      wdt_reset(); //Pet the dog
      delay(10);
    }
  }
}

//This function makes sure the display is at 57600
void initDisplay()
{
  resetDisplay(); //Forces cursor to beginning of display

  printHits(); //Update display with current hit count

  displayOn = true;

  setBrightness(DEFAULT_BRIGHTNESS);
}

//Set brightness of display
void setBrightness(int brightness)
{
  Wire.beginTransmission(DISPLAY_ADDRESS);
  Wire.write(0x7A); // Brightness control command
  Wire.write(brightness); // Set brightness level: 0% to 100%
  Wire.endTransmission();
}

void resetDisplay()
{
  //Send the reset command to the display - this forces the cursor to return to the beginning of the display
  Wire.beginTransmission(DISPLAY_ADDRESS);
  Wire.write('v');
  Wire.endTransmission();

  if (displayOn == false)
  {
    setBrightness(DEFAULT_BRIGHTNESS); //Power up display
    displayOn = true;
    lastHitTime = millis();
  }
}

//Push the current hit counter to the display
void printHits()
{
  int tempCounter = hitCounter / 2; //Cut in half

  Wire.beginTransmission(DISPLAY_ADDRESS);
  Wire.write(0x79); //Move cursor
  Wire.write(4); //To right most position

  Wire.write(tempCounter / 1000); //Send the left most digit
  tempCounter %= 1000; //Now remove the left most digit from the number we want to display
  Wire.write(tempCounter / 100);
  tempCounter %= 100;
  Wire.write(tempCounter / 10);
  tempCounter %= 10;
  Wire.write(tempCounter); //Send the right most digit

  Wire.endTransmission(); //Stop I2C transmission
}

//Clear display to save power (a screen saver of sorts)
void clearDisplay()
{
  Wire.beginTransmission(DISPLAY_ADDRESS);
  Wire.write(0x79); //Move cursor
  Wire.write(4); //To right most position

  Wire.write(' ');
  Wire.write(' ');
  Wire.write(' ');
  Wire.write(' ');

  Wire.endTransmission(); //Stop I2C transmission
}
Above is my very amateur attempt at a filter to suppress the noise and look for peaks. I arrived at this by loading the log into LibreOffice and throwing math at it until I was able to get a reasonable hit value from it. I learned two things:
- I know very little about algorithms.
- My approach is not very accurate. I’m about 28 percent off, on average. I think it’s because there are some harmonic frequencies wreaking havoc when the boxer gets into a rhythm.
I’m pretty sure you can do a lot better. So here’s the deal: We’re going to have a little contest so that we can all learn from the experts about how to do this "for reals." You can get the raw datasets here. The names of the logs contain the number of hits in each. If you don’t believe me, you can view the videos and datasets here.
If you think you can more accurately calculate speed bag hits:
- Write an algorithm that correctly outputs the number of hits contained within the datasets (get them here).
- Implement your algorithm on a microcontroller (8-bit and 32-bit micros are OK; no FPGAs; PLCs, you’re crazy.
- The most important step: Document the heck out of how you approached the problem, how you filtered the data, and ultimately how you arrived at a solution. We’re here to learn from you.
- Put your code and documentation into a public repo or website.
- Use your algorithm to tell us how many hits are contained in Mystery Dataset #1 and Mystery Dataset #2. We have videos of these sessions that we’ll post once the contest is over.
We believe in the fundamentals of Open Source Hardware. Your work must be released under an open source license of your choice. No -NC exclusions allowed. I don’t plan to make this into a product, but you must be OK with it when someone releases an accelerometer-based speed bag counter. And sells it. For money.
How do I enter?
Post a link to your repo or website in the comments. We'll be running the contest through the end of the month (6/30), and I’ll test the solutions on the counter in the gym as they come in. There are very smart people in this world, so if there are multiple successful solutions we’ll randomly select a winner, who will be announced after the contest ends and all the entries are tested.
Wait, wait. So what do I win?
We’ll fly you and a +1 to Denver, and put you up in a hotel in Boulder. I’ll show you around SparkFun, take you to the Front Range Boxing Academy so you can see your code in action and do a dinner around Boulder. If you’re out of the USA, we will pay for a plane ticket for one person instead of two.
And whoa, Billy Bitzer is way better at this than me.
Update July 5th, 2016: Thanks for all the entries! Consider the contest closed. It will take us a bit to try to implement everyone's solutions. Many look great! Please bare with us; we'll post an update and a winner as soon as we can.
Winner! You can read the winner's post as well as Barry Hannigan's amazing tutorial on his solution.


Current Numbers:
3-77hits -> 77
4-81hits -> 81
5-93hits -> 94
6-79hits -> 79
Mystery1 -> 172
Mystery2 -> 158
Status: It’s been a long road to get here, as I've reworked the algorithm 6 different times. I started out coding in Java so I could easily create a GUI and plot the data to understand how to process it. It seemed somewhat easy to make a Nate punch detector, but just wasn't confident any of those could work for other boxers. This 6th generation seems to be on its way to working for most boxers so I'm going to submit it, I wanted to get a horse in the race with all the work I've put in so far. I implemented the algorithm first in java code that I wrote in a way the can be easily ported to C. Once I was ready I then quickly ported it to C/C++ in a Visual Studio 2015 project. Next I took the code from the VS 2015 project and ported it into Nate’s original Arduino project. All the code from all 3 phases is in the Git Hub repository. I've also included a PDF design document in the repository. The Java application can be run from a Linux or Windows command line by going to the project directory and typing: "java -jar dist/SpeedBagAlg.jar <filename>"
You can view the Java source code in the src directory under Java folder with any editor or use netbeans to open the project. If your interested in using this java technique to quickly workout algorithms and then port them to microcontroller code you can see some examples on my website, here is an example of parsing AT command input data from an ESP8266 module, I plan to continue demostrating this in some of my future posts. The link is to the ported C but it has a link to the original Java code.
Project: GitHub
Approach: Since this is to run on a micro controller I decided to not use any floating point or time consuming math functions. All math used by the algorithm is integer addition, subtraction, multiplication or division. I used a Front End processor to remove bias and condition the raw input signal. Then a detection processor to find the mins and maxs to count punch. I want to add a tracking processor to track the punches and be able to open and close both amplitude and frequency thresholds plus the possibility of lighting an LED when the rhythm is staying consistent.
Front End Processor: Starts with a High Pass FIR filter to remove static bias, then decimating the signal to squelch more noise then taking the absolute value of the signal and followed by a small smoothing average to clean up the signal so it can be fed into the detection processor.
Detection Processor: Decimates the signal squelching more values near the floor to zero and then taking the magnitude squared (Mag Square) of the signal. The mag square signal is then feed into a Low Pass FIR filter. The output of the FIR filter is feed into a medium size smoothing algorithm that also spits out a delayed signal that is right in the middle of the averaged signal so it is aligned in such a way to be used as a punch threshold template. The algorithm adjusts automatically to amplitude variations to keep from getting confused on the many resonant addition and subtraction phases that seem to occur. Right now punch frequency gate is fixed at 260 ms, but this may be a problem for the same algorithm working for amateurs and speed bag pros, which is why a Tracking processor would most likely be needed to be highly accurate across boxers and different speed bag platforms.
Tracking Processor: Not implemented yet, but will track the frequency of peak punch detections and be able to better regulate punch frequency gate to be able to increase accuracy for amateurs and speed bag pros.
Thanks for having this fun competition :). I wish I could say it was easy. My numbers are: 77 for 77, 81 for 81, 93 for 93, 79 for 79, 172 for Mystery1, and 155 for Mystery2.
I used a PIC32 development board, I believe you have one in stock as well. The included C firmware project along with a pdf serve as an example of how to implement the algorithm. Link to files is here. I have to say uploading a folder to Github was not intuitive at all for me.
Thanks again!
My contribution can be found here Results: * 3-77hits.TXT: 73 hits * 4-81hits.TXT: 80 hits * 5-93hits.TXT: 83 hits * 6-79hits.TXT: 77 hits * MysteryDataSet-1.TXT: 177 hits * MysteryDataSet-2.TXT: 166 hits Thanks for the opportunity!
Hi, I did not have time to port to Arduino, but the code is very simple. I am posting today, because is the last day... Approach is three moving averages to smooth the instantaneous acceleration delta and a lower limit to discriminate low acceleration change that is not a hit. Parameters were established on trial and error to better suit the known results. Code was tested on Matlab (have fun):
cont=0; % hit count delta=0; % acceleration instantaneous delta finalmean=0; % acceleration smoothed firstmean=90; % parameter for first moving average secondmean=110; % parameter for second moving average thirdmean=30; % parameter for third moving average lowerlimit=80; % hits are above this limit for i=1:length(x)-1; delta(i)=abs(x(i+1)-x(i))+ abs(y(i+1)-y(i)) + abs(z(i+1)-z(i)); end; finalmean=movmean(movmean(movmean(delta,firstmean,'omitnan'),secondmean,'omitnan'),thirdmean,'omitnan'); for i=1:length(finalmean)-2; if (finalmean(i+2)<finalmean(i+1)) && (finalmean(i+1)>finalmean(i)) && (finalmean(i+1) > lowerlimit); cont=cont+1; end; end; display(cont);
x,y and z are your inputs and cont will give you the hits. On Arduino I believe it can count the hit in real time, after less than 1 second of turned on. Results: 3: 77 (77), 4: 81 (81), 5: 91 (93), 6: 79 (79), Mistery 1: 190, Mistery 2: 161.
Did some alterations on .ino. Maybe it runs directly, without alterations now.
Arduino code trial uploaded on Github:
https://github.com/marciopp/SparkfunBag
Code was not verified.
Matlab code on Github:
https://github.com/marciopp/SparkfunBag
As soon as I have time I will port to Arduino as the code is simple and moving averages have specific libraries already coded.
Thanks for this awesome opportunity and for convincing me to publish something open source. I really need to do more. Ive put everything I did with documentation at https://github.com/plakkiesza/speedbag This is the first time Ive used github so I hope I did not mess anything up. Im also hoping I make the deadline as its been a bit difficult to get somewhere with internet and electricity (I deal with weird stuff)
I do not have the hardware and hope my modification of the code does work.
This is what I did Take an average over the last 76 data points (152ms) if its greater than 17 count it as half a punch. Also making sure not to count punches unless they are at least 152ms apart. 1.29% seemed like I could do better Results: 3-77 result 78 error 1.29% 4-81 result 82 error 1.23% 5-93 result 93 error 0% 6-79 result 79 error 0% Mysterydataset1 = 154 Mysterydataset2 = 153
My solution, documentation, and tools can be found here... https://github.com/UofI-1996/BetterSpeedBagCounter
3-77hits --> 77 4-81hits --> 81 5-93hits --> 93
6-79hits --> 79 MysteryDataSet-1 --> 172 MysteryDataSet-2 --> 154
The PDF file gives a description of the algorithm I used and a overview of the Analysis and Test Driver applications that are also supplied in the repository.
The BetterSpeedBagCounter Analysis Tool allows you to change the parameters that affect the algorithm's filters and thresholding while seeing how it affected the detection processing.
The Arduino Sketch is currently setup to communicate with the supplied test driver application via a std. serial interface. I ran it on a Leonardo board, but it will compile targeting any standard Arduino board. The processing of the accelerometer data takes between 120-130us on the Leonardo so there is be plenty of processor left, to make improvements, even after allowing time to handle the interface with the accelerometer and display.
Thanks for the challenge! If required I can integrate the reset and processAccelerometerData functions into your existing sketch but I wanted to post the solution and test driver that people can modify/run with just a PC and any Arduino board.
My approach is at: https://github.com/tbberg/SpeedBagCounter_TBB
I found 168 hits for mystery set 1, and 160 for mystery set 2.
detected 77 hits for the 3-77 dataset
detected 78 hits for the 4-81 dataset
detected 93 hits for the 5-93 dataset
detected 83 hits for the 6-79 dataset
There seem to be some leading and trailing events in most data sets - not sure if they are actual hits as the spacing between them are larger than the others in the main body of data. These could be a source of variability. Another challenge is detecting a "weak" hit event, which may be due to a soft blow or a blow when the stand is oscillating (the blow could land when the stand is "moving away" and the net acceleration is lower, possibly zero.)
It's also curious that there are so many accelerometer timeout events. Some of the hits may be missing..... Any thoughts? Maybe due to display data line sharing/multiplexing?
Thanks for the challenge!
Todd
My code is at https://github.com/neimet/SparkfunSpeedBag
It gets all four of the known sets correct and predicts 172 hits for Mystery Data 1 and 156 hits for Mystery Data 2. I didn't run it on an arduino, but I made sure it compiles and ran a slightly modified version (so I can actually run it) as a c program.
Here's the plot it produces for the 77 hits data set.
Follow-up to what I've seen in the data: is the accelerometer over the center of the platform, or is it more "forward" (i.e. the direction where you punch out) in the platform? My guess is that it's more forward, and this causes certain hits to be felt stronger. If so, it might be helpful to have two accelerometers, one in front of and one behind the center of the platform to detect different bag-platform hits.
I uploaded my solution to https://github.com/WilliamAltemus/HitCounterChallenge
Output:
77 expected / 77 detected - 0% error
81 expected / 82 detected - 1.23% error
93 expected / 93 detected - 0% error
79 expected / 78 detected - 1.27% error
Mystery Dataset 1 - 169 detected
Mystery Dataset 2 - 155 detected
Thanks for the opportunity to participate in this challenge. It was a real learning experience!
William
My partial Arduino solution + a python script can be found here https://github.com/RobTillaart/HitCounterChallenge.
A hit results in a substantial larger acceleration (as discussed earlier) so checking the value with the previous one should do it. A straightforward python script helped to find the magic threshold between previous and new acceleration (17) used in the code. Running the python script generates:
MysteryDataSet-1.txt 454
MysteryDataSet-2.txt 186
3-77hits.txt 74
4-81hits.txt 79
5-93hits.txt 95
6-79hits.txt 83
The trainingsets in % are ~ -4, -2, +2 and +5% so on average ~0% . Applying the script on the mystery datasets gave me 454 hits and 186 hits respectively.
mmmm 454 hits sounds quite impressive, anyway that is what my quick code produced :)
Thanks! Looks pretty good. I've upvoted this and will include this in the batch to test.
Hi Nate,
Is it possible that you have the data for the 5-93hit.txt and the 6-79hit.txt mixed up? Here is what I got after looking at your data sets. (by switching the 93 hit and 79 hit data)
3-77hits → 77
4-81hits → 80
5-93hits → 94
6-79hits → 76
Mystery1 → 240
Mystery2 → 213
By looking at the first four data sets (only sets with known number of hits), this gives me an error of <4%.
What do you think? Am I in the ballpark?
Is it possible? Oh ya. I'll dig back through the logs and notes and see if I can get anything to line up but if you've got an algorithm (and it looks as tho you do) please post it. The proof is in the demo ;)
Check it: github with algorithm code.
Please let me know what you think. I would be interested to see how my Mystery numbers line up.
*disclaimer - did all of my calculations in a spreadsheet to get the above values. I then wrote the arduino code to execute my spreadsheet calculations in real time. The code does compile, but I have not downloaded it, due to the lack of a free arduino and accelerometer it the time.
*disclaimer² - I am not the best at making efficient code, but it always works... sometimes.
My answer is at https://github.com/airbornemint/SparkFun-accelerometer-challenge
Its output for the four known datasets is: 80 (77 expected, +4% error), 92 (81 expected, +14% error), 106 (93 expected, +14% error), and 76 (79 expected, -4% error).
Its output for the two mystery datasets is: 232, 172.
Enjoy.
Instead of entering the contest I'll give the rest of you a head start. Think of it as the ultimate shareware gift.
When I do this with the 77 hit data set, I see 80 hits which is a 4% error, substantially better than the 28% error Nate got.
Of course that 100 and 9 look like they came straight from the orificial oracle, but I actually got them from plotting the data with Excel and visually examining the plot. The fun part for you contestants is to figure out a self-calibrating scheme to set those thresholds automatically. By looking at the total magnitudes, you can also see how hard the hit was.
Good luck to all
Another possibility is to use jerk instead of acceleration. When the bag is punched, the momentum imparted by the fist generates an acceleration. Assuming that the rate of change of acceleration (jerk) is greater from a fist impact than from all the other sources of acceleration changes, it's a simple matter to take the instantaneous derivative of the acceleration magnitude to get jerk and then apply a threshold. Anything greater than the threshold is a hit.
Using this approach with a very quick and dirty threshold calculation, the 77 hit data set comes up with 82 hits.
To calculate the instantaneous derivative, no calculus is needed. Simply remember that the derivative of a function is the limit of delta x / delta y as delta y goes to 0. Since our data is coming in at a more or less regular interval, we can approximate this by subtracting the current magnitude of the acceleration vector from the previous value and dividing the result by the time difference between the 2.
You'll end up with positive and negative values. One is the result of fist impacts, the other of the bag hitting its stops and bouncing back. I made the assumption that the fist impacts are going to be harder, so I took the side with the largest jerk, which in this case was the positive side.
Again, I eyeballed the threshold from a plot, but you could do something more sophisticated like a statistical analysis of the jerk values and set the threshold at a certain number of standard deviations. Enjoy
Here's what my hit plot for the 77 hit data set looks like using the acceleration magnitude algorithm above (not the jerk). It's binary, in that there's either a hit or there isn't. This plot does not show the strength of each hit. That's the timestamp on the x axis, so plot out Nate's data and see how it compares. He got a nice rhythm going between 7500 and 9000.
I wish this was during the school year, my math teacher might be able to help me make heads or tales of this.
Hey Nate,
Whatever happened to this contest?? Did you declare a winner? I think that this deserves a new blog post with an update.
Floppy! Thanks for entering. You got a shout out. Barry's solution managed to pulled the rabbit out of the hat.
Although i am late, here is my implementation of Arduino based punch counter and the results are being forwarded to Android Mobile for Display. Ref: I took the lead from #barryjh and modified his algorithm to suit my scenario as the punching bag moves is random directions most of the time.
Here is a short video in which i demonstrated the working of this algo. Left side shows the output on an Android App.
https://www.youtube.com/watch?v=qgFmXZRP3lM
Nice work! Great video. I'm interested in how you setup/designed your FIR and hardware.
Thank you for hosting this contest. I will not meet the deadline but I plan to continue to work on it and want to describe what I think is a different approach.
In thinking about the problem, I see a damped system that has energy periodically added. The thought is similarly expressed by Member #815726. In order for the bag to continue oscillating, the system needs to be perturbed within a fairly narrow frequency range that is independent from the boxer's skill.
So, I think an algorithm can be made to detect and count when energy above a certain threshold and at ~about a certain frequency is input in the system. In order to do that, I use a Goertzel algorithm to efficiently detect signal power within a certain frequency range.
full project
iPython notebook
I won’t have the time to code up an entry, but in keeping with Nate’s desire to learn from each other, and to talk about approaches to the problem, I’ll share what wisdom I have. I think the essence of good engineering starts with a clear understanding of the physical principles at work in the system under consideration. At the level of the accelerometer data, things are pretty chaotic with all the shaking and bouncing around and all. But if you take a step back, it is much simpler. The bag and platform is a system with an under-damped (oscillatory) response that stores and dissipates energy. A “hit” is the way that energy is added to the system. The boxer’s job is to periodically keep adding energy to the system at a time and in an amount necessary to keep things going with some degree of consistency. So if you can somehow measure the energy contained in the system, then you can look for periodic increases in the amount of energy. The choice of sensors, mounting locations, and the mathematics of processing the data should be evaluated according to the ability to measure the energy in the system, subject to the other constraints of cost, simplicity, processing capacity, etc. And no matter what it looks like in the video, if there is no significant increase in the energy in the system, it probably shouldn’t be considered a hit.
So how do you measure energy in the system? Some of the energy is kinetic, 1/2 MV^2: movement of the bag, movement of the platform and brackets, etc. Part of it is potential: compression of the air in the bag, elastic deformation of the platform, height of the bag above rest position. As the system is bouncing and shaking, some of the energy is being converted from one form to another, but except for the boxer's punch, the overall energy will always decrease. Assuming that platform mounted accelerometers are a reasonable choice of sensor, one can integrate the signals from the accelerometers to get a profile of the velocities of the platform in each direction at any given time. By squaring these velocities, we should be able to get a snapshot of the kinetic energy profile of the system at that time, and then look for increases and decreases. I think the solution proposed by #284237 gets at this with the analysis of decreasing peaks and the variable thresholds that account for the current level of energy in the system. Todd's solution similarly looks for an pulse above a decreasing threshold that one could interpret as the decay of energy in the system. Similarly, other measures suggested, velocity of the bag, air pressure in the bag, etc. are also related to the energy content of the system.
It’s great that Nate is trying to bring the benefits of technology to the sport of boxing!
One last thought. A good solution might be to find an ultrasonic or radar doppler sensor. It could be mounted on the platform just out of reach of the bag, or on the back post or wall and aimed at the bag. Otherwise, it requires minimal modifications and should work for any speedbag. The output would be an FM signal, responsive to the velocity of the bag, which should be easier to filter and process. It would directly measure the velocity of the primary energy storage element of the system.
Hi Nate. I'm coming into this a little late, but it was good to see all the different insights to this (I think very difficult) problem from the respondents. But I have a very basic question. What are you really trying to measure? Is it hits per minute? Can a good boxer really make things go faster or is the speed pretty much determined by the natural resonance of the system? Is it a matter of getting into the rhythm of the system and keeping it consistently going - in other words, are you trying to measure "flubs" where the boxer looses sync and has to start over? Are you trying to measure how accurately the boxer hits the bag, and if so, how much of a glancing blow counts as a miss?
This is tough because what you are measuring, vibrations of the platform, are pretty far removed from the act of hitting the bag. The initial punch probably transfers some energy to the overall system (platform, brackets, etc.) which makes it respond in its own natural rhythm. Then, as others have observed, the bag appears to hit the platform multiple times per punch, each time making the platform vibrate in its own natural frequencies. To make matters worse, discs like the platform like to vibrate in many complex, non-integer harmonic modes (think of the crash of a cymbal). Then, acceleration, as a second derivative function, tends to amplify noise. On top of that, there is the natural variation in the force of each punch. Finally, there are issues with the sensors themselves, like the occasional "timeouts" in the data, and quantizing and sampling errors. To be able to find the "signal" in all that noise, I would suggest that you need to know as much about the signal as possible - hence my questions.
Theoretically, I suppose you could measure the flow of a mountain stream by measuring the noise it makes, but it would be better to measure cross section and flow velocity. Similarly, there are probably better ways to measure a boxer's skill if we can decide what that actually means.
In the meantime, what a great signal processing challenge!
Some additional thoughts: How about putting two accelerometers on wristbands? Then you could gather all kinds of info that might be of use to a boxer: punch velocity and reach, contacts and contact force, missed punches. And, this could be gathered while sparring or in a match, as well as in the speedbag workouts. Another interesting experiment might be to tape a single accelerometer to your body, like maybe on your sternum. Theoretically, punches and hits should cause corresponding movements in a boxer's body and these may be easier to detect and provide more information than the vibrations of the speedbag platform.
I also think the sensor is in the wrong place. It should be on the glove where it contacts the bag. You'll still get noisy data and have to filter it, but it should be a much easier job.
I haven't written an arduino program yet, but I have crunched the numbers in excel.
77 hit = 75 -3%
81 hit = 83 +2%
93 hit = 93 right on the money!
79 hit = 81 +3%
Mystery Set 1 = 200
Mystery Set 2 = 185
So does the solution have to be presented as functional code or can it be expressed mathematically?
I welcome anything that will help people learn but to enter it has to be a functional program. If you can post your mathematical approach you might find friendly folks to help you convert that to code. Honestly, one of the hardest parts for me is this step - I've found various academic approaches to the problem only to be bogged down when I tried to wrap my head around converting the formulas to code.
Hmm...'2047' as max readings... sounds like something is being saturated. Is this accelerometer an analog output, or digital based (spi/i2c)? If digital, is there a possibility to decrease the sensitivity (increase max-range) on the sensor itself so we have more fidelity with 'hit' values? Just curious, I like to go for the low hanging fruit in terms of optimizing this problem.
I have one other idea that could improve algorithm/solution finding: Since we are in the experimentation stage, I think it would be beneficial to have a trigger-type sensor in the boxing glove to have a synchronized truth vector to work with. As fun as it is seeming to be for some people here, I don't see why we would choose to fly blind from the get-go :-)
But hey, if that's what you'd like your challenge to really be I understand.
Thanks!
I like the microphone idea. It would be inexpensive and sensitive, as long as the microphone would take the abuse. The trick would be in mounting the microphone appropriately so that it picks up the bag punches but is less sensitive to ambient noise.
An ideal solution might be an absolute pressure sensor inside the speed bag. That would pick up the air compression from each punch but be insensitive to movement and most environmental noise. The problem is that it would need to be coupled to the air inside, which would be troublesome to implement. You would also need a pressure sensor with sufficient bandwidth to pick up individual punches. These exist, but are not the tiny surface mount kind.
Mounting the accelerometer differently would also help. Instead of mounting it to a fixed part, trying to pick up the shocks when the bag is punched, why not attach it to a small finger that moves a small amount as the bag moves a large amount. Think of it as a tiny lever or an impedance matching transformer. The accelerometer is far too sensitive to mount it directly on the bag, but a little finger that goes from the accelerometer to the top of the bag, allowing it to move slightly with each punch, would allow you to see the gross motion of the bag without clipping the acceleromoter, and without having to deal with the complicated signals received when the accelerometer is mounted to a fixed part.
This task is very challenging (and therefor interesting from the data-analysis point of view). I don't have time to participate, but I will share some of my insights which might help others. First, I took one of the files (the 77 hits one) and I watched the video many (many) times. I also ripped the audio track, and I loaded it to my analysis software (Matlab) alongside with the accelerometer data. I tried to align the audio and acc data (not trivial) and I watched and listened. I listened in the original speed and in X2 and X4 times slower rate. I am telling you all this because you might want to do it as well. The things I learned (some are facts, some hypotheses): 1. A typical hit is followed by 3 "after-hits" of the bag on the wooden top. That is, after the hit the bag goes forward, hits the top, bounces backward, hits the top, bounces forward, hits the top, and then gets hit again by the boxer. 2. The main impact is therefor not from the hit itself, but from the after-hits, since the accelerometer is mounted on the top. You can clearly see this by the fact that the z-data has the strongest signal (I am NOT talking about the constant DC due to gravity, as I subtracted the average of the first 1000 samples from each channel). 3. Therefor, I do not advise you to look at the norm of the vector (root of sum of squares), because this way you loose important information about the sign (positive or negative) of the z-component. 4. The fact that much of the signal is not from the hit we need to count, but from the after-hits, makes the task challenging.
To conclude: - don't look at the norm, use all 3 channels - if you do use the norm (as well as the 3 channels), don't subtract the gravity from it (like was suggested in some of the comment). This is mathematically wrong, that's not the way to add/subtract vectors. You add/subtract component-wise, only then take the norm. - Use the typical hit (hit followed by 3 after-hits) as the basic event to look for. - watch the videos, listen to the audio, slow it down. Look at the data before you try and solve the problem.
Well it may be as easy as a linear regression between x,y,z and hits.
Or linear regression between sqrt(xx + yy + z*z) and hits.
Tom
You can't do regression since you don't have the hits labelled. You can watch the video and hand-label, but it is hard to align the video to the accelerometer data.
What a great challenge. Just to clarify, are we trying to count punches or the number of times the bag swings back and forth? It seems like there would be two sets of things happening in this data - both the punches and the bag hitting the board.
Also, I agree with some of the other commenters about the attachment of the sensor. Is it possible to get a better data sample by playing with the mechanical connection of the sensor to the board by screwing it down tighter or attaching a (relatively) large metal plate to the board that the sensor is then attached to? Is there an amount of dampening that could be provided by a thin elastic layer between the sensor and the board?
Nice contest I hope to find some time to work on this for fun.
One thought while thinking about your design is why not use a Piezo Trigger. Seems like a much more natural sensor for this sort of application. At that point you can just use a simple threshold of the impulse and cut off any values below a given threshold. Essentially the bag hitting the platform on top would be similar to how an electric drum set works. You could use glue, tape or screw to mount the trigger to the top of the bag platform.
Hmm, neat! A Piezo Trigger is a very cool thing that I did not know existed but in this case we've got accel data. But knowing what other tools are out this is valuable as well. Thanks!
Something as simple as this would probably work: https://www.sparkfun.com/products/10293
Try taping one onto the speed bag and looking at the leads with an oscilloscope. No power supply or other circuitry needed for a simple test.
Hi Nate,
I just wanted to put out there that by adding a decimator in front of the data, that it becomes a lot less noisy. So, in this case, less is more. There is one other thing that generally cleans up accel data, which is using a Kalman filter, as it removes Gaussian noise, which is inherent to any accelerometer or gyro. It seems like taking a look at the ardupilot project should give people some hints
One other thing is that from looking at the data, if you find the total magnitude of the acceleration, it seems to just add noise to the output. This indicates that the sensor was not placed on the bag, but maybe mounted on the plate that holds the bag. Therefore, just using accel data for one axis is sufficient. Again, less is more. One thing to think about is that the X axis actually works pretty well too.
A final thing to think about is to think about using integration to help with finding "hits".
There are a couple people who appear to have nailed it, but haven't posted their algo yet. I'll post mine this evening.
I've seen data very similar to this on my first Arduino project. In that case using the Arduino as a detector was quite noisy...BECAUSE...there was a lot of stray AC noise coming in on the line voltage. This data looks very much like that. I am capable of writing an algorithm...but long before one does that please post the control data to demonstrate that you are not measuring line noise i.e. gently rotate the bag by hand for several minutes and post that data set. IF...it is noisy...then the solution is to add a capacitive gate either/and/or to the input/output of the sensor and/or to the Arduino. The other control is to hit something else, that is not the bag, for instance the frame that holds everything, and see what that signal looks like. I don't think your algorithm is particularly good or bad, I think you need to run some controls to figure out what is being measured...instead of assuming that the measurements are measuring X, as opposed to X + Q + W.
Can you give us a better description of how the hardware is attached? Or even a napkin drawing. From what I gathered the sensor is just mounted to the wooden support that the speedbag is attached to?
Hi Chris - Sorry for the ambiguity. The MMA8452Q is sitting on top of and is screwed to the wooden platform from which the bag hangs. The idea (of this particular project) was to create a thing that anyone could screw or stick to the top of the platform and get hit counts, without modifying the bag, hinge, or platform (other than attached said magical box).
I did a preliminary test using my Nexus 7 tablet with an app to capture accelerometer data. I had the screen facing up and tapped on the screen. There were significant jumps in values (possibly implying my assumption below that common mode noise is filtered to be less than ideal). So this scheme seems workable. But there are some issues remaining: [1] using FIR/IIR or even DFT/FFT filtering is out of the question, since the data sampling is not truly periodic. The closest thing to use for aperiodic data is something called a periodogram, that is not really useful for harmonic analysis. [2] The "notes" state that sampling is approximately every 2 ms, but does not state what the accelerometer's registers are setting (e.g. are they at defaults?). Register settings also affect whether or not the chip uses internal high-pass filtering (to eliminate DC offset) and some other issues. [3] From my data (before I looked at Nate's data) it looked like I could "see" my knocks and reminded me of a nonlinear "threshold" filter I did for work. The Nexus data was sampled every 5 ms (vs. Nate's 2ms) and I could see each knock as "damped ringing" of the MEMS accelerometer data with about a 10-20 sample duration. I need to compare against Nate's data to see if it too "rings" and with what periodicity (preliminary answer is it rings with a period of about 50-100 samples).
I'll get back (soon?) with an update soon.
So this setup is really a "knock" sensor. If the accelerometer were IN the bag, then it would be a punch sensor. Most accelerometers are designed to reject mechanically coupled noise, so what this is trying to do is measure the ineffectiveness of the manufacturer's mechanical isolation (which could be digital if there was another knock sensor onboard to do common-mode rejection).
I think a microphone is a better sensor for this application. Maybe one of your MEMS microphones.
Part of the issue is that the wrong sensor was used. The issue with the accel is that the gravity vector dominates in all cases and even though a one can guess at the zero motion cal state the resulting accel values in anything other than the z vector (gravity) are going to limited by the delta v of the bag and the length of the sensor from the pivot point of the mounting.
This is generating the V^2 / R (distance between mount point and sensor) values of acceleration. By inspection it's obvious that gravity is always dominate that the motion of the bag is pretty much planar although I haven't really computed the x-y rotation vectors yet.
We don't want to measure linear acceleration, we want to measure angular velocity and angular acceleration
Had a 3 axis gyro been used the hits hits would have been extremely evident since the slopes of angular velocity ( angular accel) would clearly show an external impact force opposed to the angular accel in free fall which is essentially gravity trying to rotate the bag down to the zero momentum state
If a 6 axis DOF sensor is used with something with a bit more computation horsepower (SAMD21 board) the 6 axis fusion would be able to count hits and the energy impacted on the bag given the mass of the bag and the pivot length. Gaming controller sensor fusion is usually 125 Hz so 500 Hz may be problematic just because of the I2C transfer times. I need to do some math and see if a Bosch or Invensense IMU can sample @ 4g / / 500 Hz
my 2 cents
cheers bob m (Wizard of Make / Atmel)
From this and your other reply, it would appear that you think the sensor is mounted in/on the bag itself. From the comments at the beginning of the code, this does not appear to be the case: the sensor is apparently mounted on the platform itself, not on the bag. The sensor is measuring the accelerations (movement or vibrations) that are imparted to the bag platform by the movement of the bag. Keep in mind that this is a 4G sensor: if the sensor were in the bag, you would need a sensor that could handle a much higher acceleration. Same thing for a gyro, it would have to support a very high angular rotation change rate. I agree that a 6-DOF in the bag could be a way to go, but it is at odds with Nate's "no-modification" goal (he states he wants something that can easily be screwed to the platform) and it would need a very robust sensor.
Because of the limitation of not mounting the sensor to the bag, you cannot measure the position of the bag or the accelerations that it experiences. You can only infer its movement based on its impacts with the platform and the resulting platform accelerations.
ShapeShifter nailed it. Sorry for the confusion. Sensor is mounted (screwed) to the top of the platform, mostly perpendicular to the surface of earth.
This sounds like a middle-out compression problem!
Sidebar (which you can also see by reading my code, but I am summarizing here since people asked): the sensor is giving back readings from -2048 to +2047, with Z axis baseline around -512. That means that the sensor has a 12-bit ADC and ±4g range.
Nate, A couple of questions on the data. Is the format: timestamp, x, y, z
If so z seems to always be well into the negative numbers so does this mean the output is not 1g compensated on the z axis when at rest? If the bag is just hanging it does not read 0,0,0 (so z would have -1g worth of a 12 bit signed scale)? What is the range of the scale it seems like it might be +4 to -4 g's? Sorry for all the questions, just wanted to explore other options than applying a filter on peaks of a 3D vector.
I guess you can tell I would really like to have a trip out there to talk algs with you and the crew. :)
Yes, you are correct. Sorry, the log explanation is a bit buried in the repo: you can find it here. Additionally I've updated the dataset zip to include a readme that breaks down the x/y/z.
Z is negative at approximately -512 which is 1g or earth's gravity pulling down. The X and Y axis are not quite zero because this is the physical world and things are not quite level.
Oh! What an excellent idea. I will probably twist the arm of the winner to give a lunch on learn at SparkFun. These are lunch presentations about hacking, building, etc. The last one was with Even Booth on his Terminal Cornucopia work as well as his work converting a Kuerig into a prosthetic hand. Amazing stuff.
I have a follow up question. In the 3-77 video you start out with two lefts and then switched to your right on the 3rd punch and you didn't move your paw out of the way fast enough and the bag hit it and the bag did not continue for the other two impacts of the normal punch sequence, you then steadied the bag and restarted punching. My question is, did you count that as 3 hits or 2? In looking at the data its hard to tell the difference from the 2 good hits to the miss hit. My algorithm scores 77 hits and I've verified that I count that miss hit as a hit, so I wanted to know if you counted it as a hit. I have pulled that sequence to see if it was possible to tell its a miss hit, but it seems from the additional quick contact with your fist there is almost more acceleration events created than the good hits so it might be a tall order to detect miss hits.
Thanks, Barry
I had the same problem lol. I had to look back through the video to see what was going on in that 3rd punch. Reading your 7-1-16 comment I realized we probably have a similar DSP approach. I counted it as a hit, since it looks like he hit it. He just didn't retract his hand quickly. From what I remember too, if you don't count that as a punch, then the total count comes to 76.
Yea, that would be tuff to discard that bad hit, it seems to create more acceleration then some of the early on good hits. To do it you'd probably have to make the live feed a punch estimate and then after calculating all the meta data over the total punch workout, then go back a reprocess the data to try to filter out bad hits.
I'm thinking improving from the 28% error rate to around 1% is probably good enough for what's trying to be accomplished with a low cost low hassle device.
OK, so that was gravitational acceleration. I had made it out to be about 500 just from visually examining my plot of the magnitudes. Of course, since I was looking at magnitudes and x & y never go to 0 (probably due to noise and thermal effects, as well as the bag not being level) 500 is a perfectly reasonable value when the vector math is done to find the magnitude of the acceleration vector.
BTW, Nate, you could have also used a microphone near the bag, done an FFT of the incoming audio and looked for the components that indicated a hit. That way you wouldn't have to have modified the bag.
There's a series of ways to tackle the problem. The mic is a very cool approach I had not heard of (pun intended). IR is how speed bags are currently counted. I've also seen some folks trying to modify the swivel with a photogate, reed switch, etc which becomes finicky. For this particular project my vision was for anyone to walk up to a speed bag platform, screw down a thing, and get counts without need for adjustment or calibration.